- Great Learning
- Free Courses
- Machine Learning
Descriptive Statistics Free Course
Introduction to Descriptive Statistics
Enroll In Descriptive Statistics free online course and get a completion certificate. Plus, access over 1,000 additional free courses with certificates—just sign up for free!
Instructor:
Mr. Anirudh RaoIntroduction to Descriptive Statistics
10.2K+ learners enrolled so far
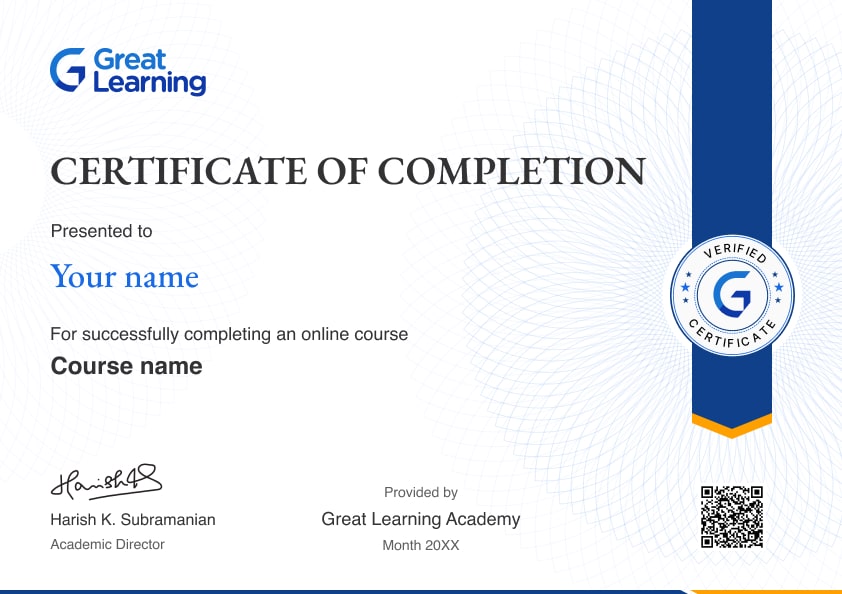
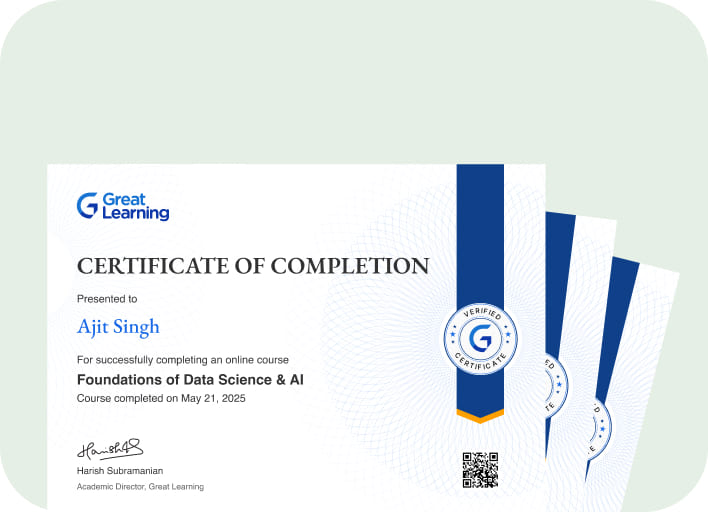
Stand out with an industry-recognized certificate
10,000+ certificates claimed, get yours today!
Get noticed by top recruiters
Share on professional channels
Globally recognised
Land your dream job
Skills you will gain
Central Tendency
Measures of Variability
Measure of Skewness
Kurtosis
Key Highlights
Get free course content
Master in-demand skills & tools
Test your skills with quizzes
About this course
A background in Statistics can prepare you for a wide range of job opportunities ranging from being a pure statistical researcher to a highly sought after data scientist. Keeping the importance of Statistics in mind, this course on Descriptive Statistics will introduce you to the basics of Statistics, central tendancy, variablility, skewness, and kurtosis.
Check out our PG Course in Machine learning Today.
Course outline
Introduction to Statistics
Statistics is the discipline of science that deals with studying the collection of data, analyzing, interpreting, and presenting empirical data. It explores the variation in the set of data.
What is Statistics?
Data Collection for Statistics
Statistics uses many approaches to collect the data for statistical analysis. Direct observation, Experiments, and surveys are the most popular methods to obtain data for statistical analysis. The survey collects data from people through Gallup polls, pre-election polls, marketing surveys, and other forms.
Types of Statistical Analysis
Descriptive Statistical analysis deals with organizing and interpreting data using graphical and numerical methods, such as Inferential Statistical Analysis, Predictive Analysis, Prescriptive Analysis, Casual Analysis, Mechanistic Analysis are the standard statistical analysis techniques used in Descriptive Statistics.
Measures of Central Tendency
This section describes measures of central tendency by formulating to solve for the previously mentioned example. It also analyzes various metrics of the solution through graphs.
Measures of Variability
In Descriptive Statistics, Variability is generally measured with statistical metrics such as Range, Interquartile range, and Standard deviation. You will learn these metrics in detail further in this section.
Measure of Relationships
A statistical measure that shows the relationship between two or more variables or between two or more sets of data, such as the correlation between two variables. For example, education and academic achievement.
Measure of Skewness
In Descriptive Statistics, Skewness measures the degree and direction of asymmetry. The skewness is zero in a normal distribution, and when the mean is less than the median, the distribution has negative skewness.
Understanding Kurtosis
Kurtosis is a measure of data to check if it is the profusion of outliers or lack of outliers relative to normal distribution. The normal distribution of kurtosis is zero.
Get access to the complete curriculum once you enroll in the course
Stand out with an industry-recognized certificate
10,000+ certificates claimed, get yours today!
Get noticed by top recruiters
Share on professional channels
Globally recognised
Land your dream job

Introduction to Descriptive Statistics

1.5 Hours
Beginner
10.2K+ learners enrolled so far
Get free course content
Master in-demand skills & tools
Test your skills with quizzes
Learner reviews of the Free Courses


5.0

Our course instructor

Mr. Anirudh Rao
Machine Learning Expert
Frequently Asked Questions
Will I receive a certificate upon completing this free course?
Is this course free?
What is meant by descriptive statistics, with example?
Descriptive statistics quantitatively describe features from a data set and use this data to analyze the statistics. This statistical data is processed and applied to various fields of sciences and mathematics to analyze the information. For example, the average run rate in a cricket match.
Is descriptive statistics qualitative or quantitative?
Descriptive statistics are quantitative, and they usually describe numbers in all of their calculations and analyses. They involve methods to calculate mode, mean, median, variance, and quantitative measures.
What is the purpose of descriptive statistics?
Descriptive statistics describe and summarize the features of a sample or a data set, like variables' mean, standard deviation, or frequency. Inferential statistics help the analysts understand the collective properties of the data set elements. Being aware of the data set sample's mean-variance and distribution helps any individual understand everything around.
How do you do descriptive statistics?
Descriptive statistical methods are carried out by performing measures of center, such as mean, median, and mode. These measures are performed at almost all levels of mathematics and statistics. Mean is calculated by adding all the figures and dividing it by the total number of figures present in the data set; median is the middle numerical figure in the data set that separates the upper and the lower half; while the mode is the result of the difference of the highest and the lowest figures in the data set.
Will I get a certificate after completing this Descriptive Statistics free course?
Yes, you will get a certificate of completion for Descriptive Statistics after completing all the modules and cracking the assessment. The assessment tests your knowledge of the subject and badges your skills.
How much does this Descriptive Statistics course cost?
It is an entirely free course from Great Learning Academy. Anyone interested in learning the basics of Descriptive Statistics can get started with this course.
Is there any limit on how many times I can take this free course?
Once you enroll in the Descriptive Statistics course, you have lifetime access to it. So, you can log in anytime and learn it for free online.
Can I sign up for multiple courses from Great Learning Academy at the same time?
Yes, you can enroll in as many courses as you want from Great Learning Academy. There is no limit to the number of courses you can enroll in at once, but since the courses offered by Great Learning Academy are free, we suggest you learn one by one to get the best out of the subject.
Why choose Great Learning Academy for this free Descriptive Statistics course?
Great Learning Academy provides this Descriptive Statistics course for free online. The course is self-paced and helps you understand various topics that fall under the subject with solved problems and demonstrated examples. The course is carefully designed, keeping in mind to cater to both beginners and professionals, and is delivered by subject experts. Great Learning is a global ed-tech platform dedicated to developing competent professionals. Great Learning Academy is an initiative by Great Learning that offers in-demand free online courses to help people advance in their jobs. More than 5 million learners from 140 countries have benefited from Great Learning Academy's free online courses with certificates. It is a one-stop place for all of a learner's goals.
What are the steps to enroll in this Descriptive Statistics course?
Enrolling in any of the Great Learning Academy’s courses is just one step process. Sign-up for the course, you are interested in learning through your E-mail ID and start learning them for free online.
Will I have lifetime access to this free Descriptive Statistics course?
Yes, once you enroll in the course, you will have lifetime access, where you can log in and learn whenever you want to.
Become a Skilled Professional with Pro Courses
Gain work-ready skills with guided projects, top faculty and AI tools, all at an affordable price.


View Course

Included with Pro+ Subscription

View Course

Included with Pro+ Subscription

View Course

Included with Pro+ Subscription

View Course

Included with Pro+ Subscription

View Course

Included with Pro+ Subscription


View Course

Included with Pro+ Subscription

View Course

Included with Pro+ Subscription
.jpg)
View Course

Included with Pro+ Subscription


View Course

Included with Pro+ Subscription


View Course

Included with Pro+ Subscription


View Course

Included with Pro+ Subscription


View Course

Included with Pro+ Subscription


View Course

Included with Pro+ Subscription
.png)
View Course

Included with Pro+ Subscription

View Course

Included with Pro+ Subscription

View Course

Included with Pro+ Subscription

View Course

Included with Pro+ Subscription

View Course

Included with Pro+ Subscription


View Course

Included with Pro+ Subscription

View Course

Included with Pro+ Subscription
.jpg)
View Course

Included with Pro+ Subscription
.png)
View Course

Included with Pro+ Subscription

View Course

Included with Pro+ Subscription
.png)
View Course

Included with Pro+ Subscription
.png)
View Course

Included with Pro+ Subscription
View Course

Included with Pro+ Subscription
.jpeg)
View Course

Included with Pro+ Subscription

View Course

Included with Pro+ Subscription
.png)
View Course

Included with Pro+ Subscription
.png)
View Course

Included with Pro+ Subscription
.png)
View Course

Included with Pro+ Subscription

View Course

Included with Pro+ Subscription
.png)
View Course

Included with Pro+ Subscription
.png)
View Course

Included with Pro+ Subscription


View Course

Included with Pro+ Subscription


View Course

Included with Pro+ Subscription

View Course

Included with Pro+ Subscription

View Course

Included with Pro+ Subscription
.jpg)
View Course

Included with Pro+ Subscription

View Course

Included with Pro+ Subscription

View Course

Included with Pro+ Subscription


View Course

Included with Pro+ Subscription

View Course

Included with Pro+ Subscription
.png)
.png)
View Course

Included with Pro+ Subscription
.png)
View Course

Included with Pro+ Subscription
.png)
View Course

Included with Pro+ Subscription


View Course

Included with Pro+ Subscription

View Course

Included with Pro+ Subscription
.png)

.jpg)

.jpg)


View Course

Included with Pro+ Subscription
Popular


View Course

Included with Pro+ Subscription

View Course

Included with Pro+ Subscription

View Course

Included with Pro+ Subscription


View Course

Included with Pro+ Subscription

View Course

Included with Pro+ Subscription


View Course

Included with Pro+ Subscription

View Course

Included with Pro+ Subscription
.jpg)
View Course

Included with Pro+ Subscription
Microsoft Courses


View Course

Included with Pro+ Subscription


View Course

Included with Pro+ Subscription


View Course

Included with Pro+ Subscription


View Course

Included with Pro+ Subscription


View Course

Included with Pro+ Subscription
Data Science & ML
.png)
View Course

Included with Pro+ Subscription

View Course

Included with Pro+ Subscription

View Course

Included with Pro+ Subscription

View Course

Included with Pro+ Subscription

View Course

Included with Pro+ Subscription


View Course

Included with Pro+ Subscription
Management

View Course

Included with Pro+ Subscription
.jpg)
View Course

Included with Pro+ Subscription
.png)
View Course

Included with Pro+ Subscription

View Course

Included with Pro+ Subscription
.png)
View Course

Included with Pro+ Subscription
.png)
View Course

Included with Pro+ Subscription

View Course

Included with Pro+ Subscription
.jpeg)
View Course

Included with Pro+ Subscription
.jpg)
View Course

Included with Pro+ Subscription
.jpg)
View Course

Included with Pro+ Subscription

View Course

Included with Pro+ Subscription
 (1).jpg)
View Course

Included with Pro+ Subscription
.png)
View Course

Included with Pro+ Subscription
.png)
View Course

Included with Pro+ Subscription

View Course

Included with Pro+ Subscription
.png)
View Course

Included with Pro+ Subscription
IT & Software

View Course

Included with Pro+ Subscription
.png)
View Course

Included with Pro+ Subscription
.png)
View Course

Included with Pro+ Subscription
.png)
View Course

Included with Pro+ Subscription

View Course

Included with Pro+ Subscription
.png)
View Course

Included with Pro+ Subscription
.png)
View Course

Included with Pro+ Subscription


View Course

Included with Pro+ Subscription
.jpg)
View Course

Included with Pro+ Subscription

View Course

Included with Pro+ Subscription

View Course

Included with Pro+ Subscription

View Course

Included with Pro+ Subscription
View Course

Included with Pro+ Subscription


View Course

Included with Pro+ Subscription

View Course

Included with Pro+ Subscription


View Course

Included with Pro+ Subscription

View Course

Included with Pro+ Subscription

View Course

Included with Pro+ Subscription

View Course

Included with Pro+ Subscription

View Course

Included with Pro+ Subscription
 (1).png)
View Course

Included with Pro+ Subscription

View Course

Included with Pro+ Subscription
AI & Generative AI


View Course

Included with Pro+ Subscription

View Course

Included with Pro+ Subscription

View Course

Included with Pro+ Subscription
.jpg)
View Course

Included with Pro+ Subscription

View Course

Included with Pro+ Subscription

View Course

Included with Pro+ Subscription


Cyber Security

View Course

Included with Pro+ Subscription

View Course

Included with Pro+ Subscription
.png)
.png)
View Course

Included with Pro+ Subscription
.png)
View Course

Included with Pro+ Subscription
.png)
View Course

Included with Pro+ Subscription
Cloud Computing


View Course

Included with Pro+ Subscription

View Course

Included with Pro+ Subscription
.png)

.jpg)

.jpg)


View Course

Included with Pro+ Subscription
.png)
View Course

Included with Pro+ Subscription




View Course

Included with Pro+ Subscription


View Course

Included with Pro+ Subscription
.png)

View Course

Included with Pro+ Subscription
.png)

View Course

Included with Pro+ Subscription
Subscribe to Academy Pro+ & get exclusive features
$25/month
No credit card required

Learn from 40+ Pro courses
Access 500+ certificates for free
700+ Practice exercises & guided projects

Prep with AI mock interviews & resume builder
Recommended Free Machine Learning courses



Similar courses you might like


View Course


Related Machine Learning Courses
-
Personalized Recommendations
Placement assistance
Personalized mentorship
Detailed curriculum
Learn from world-class faculties
50% Average salary hike -


Johns Hopkins University
Certificate Program in AI Business Strategy10 weeks · Online
Know More
-


Walsh College
MS in Artificial Intelligence & Machine Learning2 Years · Online
Know More
-


MIT Professional Education
No Code AI and Machine Learning: Building Data Science Solutions12 Weeks · Online · Weekend
Learn from MIT FacultyKnow More


