- Great Learning
- Free Courses
- Machine Learning

Earn a certificate & get recognized
Excel Regression Analysis
Take up free excel regression analysis course for your level & find the relation between variables.
Instructor:
Dr. Bappaditya MukhopadhyayExcel Regression Analysis
18.7K+ learners enrolled so far
Stand out with an industry-recognized certificate
10,000+ certificates claimed, get yours today!
Get noticed by top recruiters
Share on professional channels
Globally recognised
Land your dream job

Skills you will gain
Hands on knowledge of Regression Analysis using Excel
Key Highlights
Get free course content
Master in-demand skills & tools
Test your skills with quizzes
About this course
In this excel regression analysis course, you will learn the basic concepts and its importance in predictive modeling. You will understand the difference between Simple vs Multiple Regression and how they work. You will gain hands-on knowledge of regression using excel.
Check out our PG Course in Machine learning Today.
Course outline
Regression Analysis
Introduction to Hive Hands-On
Hive is a data warehouse used to support interaction between the user and HDFS. This course will give you a demonstration using sample problem statements for your better understanding.
Simple vs Multiple Regression
Key Indicators of Regression Output
Estimation of Regression Equation
Analysis of the Regression Output
Get access to the complete curriculum once you enroll in the course
Stand out with an industry-recognized certificate
10,000+ certificates claimed, get yours today!
Get noticed by top recruiters
Share on professional channels
Globally recognised
Land your dream job

Excel Regression Analysis

1.5 Hours
Intermediate
18.7K+ learners enrolled so far
Get free course content
Master in-demand skills & tools
Test your skills with quizzes
Learner reviews of the Free Courses

5.0
5.0

5.0
What our learners enjoyed the most
Skill & tools
64% of learners found all the desired skills & tools
Our course instructor

Dr. Bappaditya Mukhopadhyay
Professor - Analytics & Statistics, Great Lakes Institute of Management
Machine Learning Expert
Frequently Asked Questions
Will I receive a certificate upon completing this free course?
Is this course free?
How do I do Regression Analysis in Excel?
To run this Analysis, you must ensure that Excel has a Data Analysis ToolPak add-in. To get this add-in, click on the File tab, options, click on the Add-Ins category, select Analysis ToolPak, and click Go. Check Analysis Toolpak and click Ok. You can go to the Data tab and into the Analysis group to find Data Analysis and click on it. Select Regression and click Ok. Select the X and Y ranges, check the residuals and click Ok. You will get your required output.
What does Regression Analysis show in Excel?
Regression Analysis helps determine the relationship between a set of independent and dependent variables, and it produces an equation in which the coefficient determines the relation between these variables.
What does Regression Analysis tell you?
Regression Analysis has a pretty good impact on identifying the variables that are affecting the area of interest. Its analysis helps one determine the relationship between the dependent and independent variables.
Can I learn Regression Analysis for free?
Yes, You can now learn Regression Analysis for free. There are various platforms and websites that provide free courses for learners. Great Learning is a platform that offers a free Excel Regression Analysis course. You can now enroll in the course and attain certificate in Excel Regression Analysis.
Will I get a certificate after completing this Excel Regression Analysis free course?
Yes, you will get a certificate of completion for Excel Regression Analysis after completing all the modules and cracking the assessment. The assessment tests your knowledge of the subject and badges your skills.
How much does this Excel Regression Analysis course cost?
It is an entirely free course from Great Learning Academy. Anyone interested in learning the basics of Excel Regression Analysis can get started with this course.
Is there any limit on how many times I can take this free course?
Once you enroll in the Excel Regression Analysis course, you have lifetime access to it. So, you can log in anytime and learn it for free online.
Can I sign up for multiple courses from Great Learning Academy at the same time?
Yes, you can enroll in as many courses as you want from Great Learning Academy. There is no limit to the number of courses you can enroll in at once, but since the courses offered by Great Learning Academy are free, we suggest you learn one by one to get the best out of the subject.
Why choose Great Learning Academy for this free Excel Regression Analysis course?
Great Learning Academy provides this Excel Regression Analysis course for free online. The course is self-paced and helps you understand various topics that fall under the subject with solved problems and demonstrated examples. The course is carefully designed, keeping in mind to cater to both beginners and professionals, and is delivered by subject experts.
Great Learning is a global ed-tech platform dedicated to developing competent professionals. Great Learning Academy is an initiative by Great Learning that offers in-demand free online courses to help people advance in their jobs. More than 5 million learners from 140 countries have benefited from Great Learning Academy's free online courses with certificates. It is a one-stop place for all of a learner's goals.
What are the steps to enroll in this Excel Regression Analysis course?
Enrolling in any of the Great Learning Academy’s courses is just one step process. Sign-up for the course, you are interested in learning through your E-mail ID and start learning them for free online.
Will I have lifetime access to this free Excel Regression Analysis course?
Yes, once you enroll in the course, you will have lifetime access, where you can log in and learn whenever you want to.
Become a Skilled Professional with Pro Courses
Gain work-ready skills with guided projects, top faculty and AI tools, all at an affordable price.


View Course

Included with Pro+ Subscription

View Course

Included with Pro+ Subscription

View Course

Included with Pro+ Subscription

View Course

Included with Pro+ Subscription

View Course

Included with Pro+ Subscription


View Course

Included with Pro+ Subscription

View Course

Included with Pro+ Subscription
.jpg)
View Course

Included with Pro+ Subscription


View Course

Included with Pro+ Subscription


View Course

Included with Pro+ Subscription


View Course

Included with Pro+ Subscription


View Course

Included with Pro+ Subscription


View Course

Included with Pro+ Subscription


.png)
View Course

Included with Pro+ Subscription

View Course

Included with Pro+ Subscription

View Course

Included with Pro+ Subscription

View Course

Included with Pro+ Subscription


View Course

Included with Pro+ Subscription

View Course

Included with Pro+ Subscription

View Course

Included with Pro+ Subscription

View Course

Included with Pro+ Subscription
.png)
View Course

Included with Pro+ Subscription
.jpg)
View Course

Included with Pro+ Subscription
.jpeg)
View Course

Included with Pro+ Subscription
.jpg)
View Course

Included with Pro+ Subscription
.jpg)
View Course

Included with Pro+ Subscription
View Course

Included with Pro+ Subscription


View Course

Included with Pro+ Subscription


View Course

Included with Pro+ Subscription


View Course

Included with Pro+ Subscription
.png)
View Course

Included with Pro+ Subscription


.png)

View Course

Included with Pro+ Subscription

View Course

Included with Pro+ Subscription

View Course

Included with Pro+ Subscription
.png)
View Course

Included with Pro+ Subscription
.png)
View Course

Included with Pro+ Subscription
.png)
View Course

Included with Pro+ Subscription
View Course

Included with Pro+ Subscription

View Course

Included with Pro+ Subscription

View Course

Included with Pro+ Subscription
.jpg)
View Course

Included with Pro+ Subscription
.png)
View Course

Included with Pro+ Subscription

View Course

Included with Pro+ Subscription

View Course

Included with Pro+ Subscription
View Course

Included with Pro+ Subscription


View Course

Included with Pro+ Subscription

View Course

Included with Pro+ Subscription

View Course

Included with Pro+ Subscription
.jpg)
View Course

Included with Pro+ Subscription

View Course

Included with Pro+ Subscription

View Course

Included with Pro+ Subscription
Popular


View Course

Included with Pro+ Subscription

View Course

Included with Pro+ Subscription

View Course

Included with Pro+ Subscription


View Course

Included with Pro+ Subscription

View Course

Included with Pro+ Subscription


View Course

Included with Pro+ Subscription

View Course

Included with Pro+ Subscription
.jpg)
View Course

Included with Pro+ Subscription
Microsoft Courses


View Course

Included with Pro+ Subscription


View Course

Included with Pro+ Subscription


View Course

Included with Pro+ Subscription


View Course

Included with Pro+ Subscription


View Course

Included with Pro+ Subscription


Data Science & ML
.png)
View Course

Included with Pro+ Subscription

View Course

Included with Pro+ Subscription

View Course

Included with Pro+ Subscription

View Course

Included with Pro+ Subscription


View Course

Included with Pro+ Subscription

View Course

Included with Pro+ Subscription
Management

View Course

Included with Pro+ Subscription

View Course

Included with Pro+ Subscription
.png)
View Course

Included with Pro+ Subscription
.jpg)
View Course

Included with Pro+ Subscription
.jpeg)
View Course

Included with Pro+ Subscription
.jpg)
View Course

Included with Pro+ Subscription
.jpg)
View Course

Included with Pro+ Subscription

View Course

Included with Pro+ Subscription

View Course

Included with Pro+ Subscription
.png)
View Course

Included with Pro+ Subscription
.png)
View Course

Included with Pro+ Subscription
.png)
View Course

Included with Pro+ Subscription
 (1).jpg)
View Course

Included with Pro+ Subscription

View Course

Included with Pro+ Subscription
.png)
View Course

Included with Pro+ Subscription
.png)
View Course

Included with Pro+ Subscription
Cloud Computing


View Course

Included with Pro+ Subscription


View Course

Included with Pro+ Subscription


View Course

Included with Pro+ Subscription
.png)
View Course

Included with Pro+ Subscription


.png)


View Course

Included with Pro+ Subscription


View Course

Included with Pro+ Subscription
.png)

View Course

Included with Pro+ Subscription
.jpg)

.jpg)

.png)

View Course

Included with Pro+ Subscription


Cyber Security

View Course

Included with Pro+ Subscription

View Course

Included with Pro+ Subscription
.png)
View Course

Included with Pro+ Subscription
.png)
View Course

Included with Pro+ Subscription
.png)
View Course

Included with Pro+ Subscription
IT & Software

View Course

Included with Pro+ Subscription

View Course

Included with Pro+ Subscription

View Course

Included with Pro+ Subscription
.jpg)
View Course

Included with Pro+ Subscription
.png)
View Course

Included with Pro+ Subscription

View Course

Included with Pro+ Subscription

View Course

Included with Pro+ Subscription

View Course

Included with Pro+ Subscription
View Course

Included with Pro+ Subscription


View Course

Included with Pro+ Subscription
 (1).png)
View Course

Included with Pro+ Subscription


View Course

Included with Pro+ Subscription

View Course

Included with Pro+ Subscription


View Course

Included with Pro+ Subscription
.png)
View Course

Included with Pro+ Subscription
.png)
View Course

Included with Pro+ Subscription

View Course

Included with Pro+ Subscription

View Course

Included with Pro+ Subscription

View Course

Included with Pro+ Subscription

View Course

Included with Pro+ Subscription

View Course

Included with Pro+ Subscription
AI & Generative AI


View Course

Included with Pro+ Subscription

View Course

Included with Pro+ Subscription

View Course

Included with Pro+ Subscription
.jpg)
View Course

Included with Pro+ Subscription

View Course

Included with Pro+ Subscription

View Course

Included with Pro+ Subscription
Subscribe to Academy Pro+ & get exclusive features
$25/month
No credit card required

Learn from 40+ Pro courses
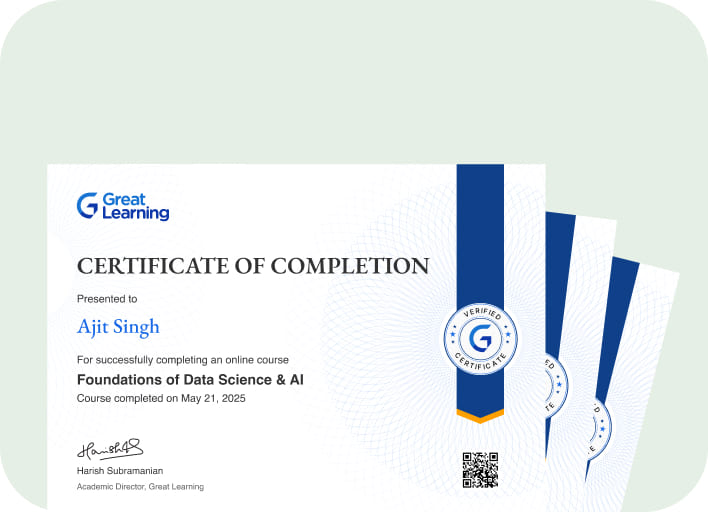
Access 500+ certificates for free
700+ Practice exercises & guided projects

Prep with AI mock interviews & resume builder
Recommended Free Machine Learning courses


Similar courses you might like


View Course

Related Machine Learning Courses
-
Personalized Recommendations
Placement assistance
Personalized mentorship
Detailed curriculum
Learn from world-class faculties
50% Average salary hike -


Johns Hopkins University
Certificate Program in AI Business Strategy10 weeks · Online
Know More
-


Walsh College
MS in Artificial Intelligence & Machine Learning2 Years · Online
Know More
-


MIT Professional Education
No Code AI and Machine Learning: Building Data Science Solutions12 Weeks · Online · Weekend
Learn from MIT FacultyKnow More


