- Great Learning
- Free Courses
- Machine Learning
Earn a certificate & get recognized
Python Matplotlib
Unlock the potential of your data with our complimentary course on Matplotlib in Python! Enroll now and transform your data into visually stunning insights!
Instructor:
Mr. Bharani AkellaPython Matplotlib
12.4K+ learners enrolled so far
Stand out with an industry-recognized certificate
10,000+ certificates claimed, get yours today!
Get noticed by top recruiters
Share on professional channels
Globally recognised
Land your dream job
Skills you will gain
Line Plot
Bar Plot
Horizontal Bar Plot
Scatter Plot
Histograms
Box Plot
Violin Plot
Pie Chart
Donut Chart
+4 More
Key Highlights
Get free course content
Master in-demand skills & tools
Test your skills with quizzes
About this course
In this free Python Matplotlib course, you will learn about how you can use multiple types of plots and operations based on them.
Matplotlib is a popular and most commonly used Python package that works with data visualizations. It is a cross-platform library to work with creating multiple plots using data that are present in the form of arrays.
Matplotlib is designed in Python and uses a numerical mathematics extension of Python, NumPy. Ample amount of examples are provided to help you have full clarity on how you can work on and understand fully how these visualizations work.
Check out our PG Course in Machine learning Today.
Course outline
Line Plot
The objective of this module is to impart an understanding of line plots and the process of creating them.
Scatter Plot
The aim of this module is to elaborate on scatter plots, including the procedure for creating them and the ways they are utilized to analyze the relationship between two numerical data points.
Bar Plot and Horizontal Bar Plot
The emphasis of this module is on bar plots and horizontal plots, including the steps involved in creating them.
Histogram and Box Plot
The purpose of this module is to elaborate on the histogram and box plot. A histogram provides insights into the distribution of a continuous numerical data column, while a box plot presents a five number summary.
Violin Plot, Pie Chart and Donut Chart
The focus of this module is on the violin plot, as well as charts like pie charts and donut charts and the process of creating them.
Get access to the complete curriculum once you enroll in the course
Stand out with an industry-recognized certificate
10,000+ certificates claimed, get yours today!
Get noticed by top recruiters
Share on professional channels
Globally recognised
Land your dream job

Python Matplotlib

1.5 Hours
Beginner
12.4K+ learners enrolled so far
Get free course content
Master in-demand skills & tools
Test your skills with quizzes
Refer and earn
Get learning discounts up to $20
Learner reviews of the Free Courses

5.0
5.0

5.0

4.0
4.0

5.0

5.0
5.0
What our learners enjoyed the most
Skill & tools
62% of learners found all the desired skills & tools
Our course instructor

Mr. Bharani Akella
Data Scientist
Machine Learning Expert
Frequently Asked Questions
Will I receive a certificate upon completing this free course?
Is this course free?
What is Matplotlib Pyplot in Python?
How do I run Matplotlib in Python?
To run Matplotlib, you first need to install it :
- Install Matplotlib along with pip. It can be installed using the Python package manager, pip. Open a terminal window and enter: pip install Matplotlib, to install Matplotlib with pip.
- Install Matplotlib along with Anaconda Prompt since they can be installed together.
Why is Matplotlib used in Python?
Matplotlib is Python programming’s plotting library and its numerical mathematics extension NumPy. It supports object-oriented API for embedding plots into the applications through general-purpose GUI toolkits such as Tkinter, wxPython, Qt, or GTK.
Will I get a certificate after completing this Python Matplotlib free course?
Yes, you will get a certificate of completion for Python Matplotlib after completing all the modules and cracking the assessment. The assessment tests your knowledge of the subject and badges your skills.
How much does this Python Matplotlib course cost?
It is an entirely free course from Great Learning Academy. Anyone interested in learning the basics of Python Matplotlib can get started with this course.
Is there any limit on how many times I can take this free course?
Once you enroll in the Python Matplotlib course, you have lifetime access to it. So, you can log in anytime and learn it for free online.
Can I sign up for multiple courses from Great Learning Academy at the same time?
Yes, you can enroll in as many courses as you want from Great Learning Academy. There is no limit to the number of courses you can enroll in at once, but since the courses offered by Great Learning Academy are free, we suggest you learn one by one to get the best out of the subject.
Why choose Great Learning Academy for this free Python Matplotlib course?
Great Learning Academy provides this Python Matplotlib course for free online. The course is self-paced and helps you understand various topics that fall under the subject with solved problems and demonstrated examples. The course is carefully designed, keeping in mind to cater to both beginners and professionals, and is delivered by subject experts.
Great Learning is a global ed-tech platform dedicated to developing competent professionals. Great Learning Academy is an initiative by Great Learning that offers in-demand free online courses to help people advance in their jobs. More than 5 million learners from 140 countries have benefited from Great Learning Academy's free online courses with certificates. It is a one-stop place for all of a learner's goals.
What are the steps to enroll in this Python Matplotlib course?
Enrolling in any of the Great Learning Academy’s courses is just one step process. Sign-up for the course, you are interested in learning through your E-mail ID and start learning them for free online.
Will I have lifetime access to this free Python Matplotlib course?
Yes, once you enroll in the course, you will have lifetime access, where you can log in and learn whenever you want to.
Become a Skilled Professional with Pro Courses
Gain work-ready skills with guided projects, top faculty and AI tools, all at an affordable price.


View Course

Included with Pro+ Subscription
View Course

Included with Pro+ Subscription
.jpg)
View Course

Included with Pro+ Subscription


View Course

Included with Pro+ Subscription


View Course

Included with Pro+ Subscription

View Course

Included with Pro+ Subscription

View Course

Included with Pro+ Subscription
View Course

Included with Pro+ Subscription


View Course

Included with Pro+ Subscription

View Course

Included with Pro+ Subscription

View Course

Included with Pro+ Subscription
.jpg)
View Course

Included with Pro+ Subscription

View Course

Included with Pro+ Subscription

View Course

Included with Pro+ Subscription


View Course

Included with Pro+ Subscription

View Course

Included with Pro+ Subscription


View Course

Included with Pro+ Subscription


View Course

Included with Pro+ Subscription


View Course

Included with Pro+ Subscription


.png)
View Course

Included with Pro+ Subscription

View Course

Included with Pro+ Subscription
View Course

Included with Pro+ Subscription

View Course

Included with Pro+ Subscription
View Course

Included with Pro+ Subscription


View Course

Included with Pro+ Subscription
.jpg)
View Course

Included with Pro+ Subscription
View Course

Included with Pro+ Subscription
View Course

Included with Pro+ Subscription
.png)
View Course

Included with Pro+ Subscription
View Course

Included with Pro+ Subscription

View Course

Included with Pro+ Subscription
View Course

Included with Pro+ Subscription

View Course

Included with Pro+ Subscription


View Course

Included with Pro+ Subscription

View Course

Included with Pro+ Subscription

View Course

Included with Pro+ Subscription
.png)
View Course

Included with Pro+ Subscription
.jpg)
View Course

Included with Pro+ Subscription
.jpeg)
View Course

Included with Pro+ Subscription
.jpg)
View Course

Included with Pro+ Subscription
.jpg)
View Course

Included with Pro+ Subscription
View Course

Included with Pro+ Subscription

View Course

Included with Pro+ Subscription


View Course

Included with Pro+ Subscription


View Course

Included with Pro+ Subscription


View Course

Included with Pro+ Subscription
.png)
View Course

Included with Pro+ Subscription


.png)

View Course

Included with Pro+ Subscription

View Course

Included with Pro+ Subscription

View Course

Included with Pro+ Subscription

View Course

Included with Pro+ Subscription
.png)
View Course

Included with Pro+ Subscription
.png)
View Course

Included with Pro+ Subscription
.png)
View Course

Included with Pro+ Subscription
Popular


View Course

Included with Pro+ Subscription

View Course

Included with Pro+ Subscription
.jpg)
View Course

Included with Pro+ Subscription


View Course

Included with Pro+ Subscription


View Course

Included with Pro+ Subscription

View Course

Included with Pro+ Subscription

View Course

Included with Pro+ Subscription

View Course

Included with Pro+ Subscription
AI & Generative AI


View Course

Included with Pro+ Subscription

View Course

Included with Pro+ Subscription

View Course

Included with Pro+ Subscription
.jpg)
View Course

Included with Pro+ Subscription

View Course

Included with Pro+ Subscription

View Course

Included with Pro+ Subscription
Microsoft Courses


View Course

Included with Pro+ Subscription


View Course

Included with Pro+ Subscription


View Course

Included with Pro+ Subscription


View Course

Included with Pro+ Subscription


View Course

Included with Pro+ Subscription


Data Science & ML
.png)
View Course

Included with Pro+ Subscription

View Course

Included with Pro+ Subscription

View Course

Included with Pro+ Subscription

View Course

Included with Pro+ Subscription

View Course

Included with Pro+ Subscription


View Course

Included with Pro+ Subscription
IT & Software
.jpg)
View Course

Included with Pro+ Subscription

View Course

Included with Pro+ Subscription

View Course

Included with Pro+ Subscription
.png)
View Course

Included with Pro+ Subscription

View Course

Included with Pro+ Subscription

View Course

Included with Pro+ Subscription

View Course

Included with Pro+ Subscription

View Course

Included with Pro+ Subscription


View Course

Included with Pro+ Subscription
 (1).png)
View Course

Included with Pro+ Subscription


View Course

Included with Pro+ Subscription

View Course

Included with Pro+ Subscription


View Course

Included with Pro+ Subscription

View Course

Included with Pro+ Subscription
View Course

Included with Pro+ Subscription
.png)
View Course

Included with Pro+ Subscription
.png)
View Course

Included with Pro+ Subscription
View Course

Included with Pro+ Subscription

View Course

Included with Pro+ Subscription

View Course

Included with Pro+ Subscription

View Course

Included with Pro+ Subscription

View Course

Included with Pro+ Subscription
Management

View Course

Included with Pro+ Subscription

View Course

Included with Pro+ Subscription
.png)
View Course

Included with Pro+ Subscription
.jpg)
View Course

Included with Pro+ Subscription
.jpeg)
View Course

Included with Pro+ Subscription
.jpg)
View Course

Included with Pro+ Subscription
.jpg)
View Course

Included with Pro+ Subscription

View Course

Included with Pro+ Subscription

View Course

Included with Pro+ Subscription
.png)
View Course

Included with Pro+ Subscription
.png)
View Course

Included with Pro+ Subscription
.png)
View Course

Included with Pro+ Subscription
 (1).jpg)
View Course

Included with Pro+ Subscription

View Course

Included with Pro+ Subscription
.png)
View Course

Included with Pro+ Subscription
.png)
View Course

Included with Pro+ Subscription
Cloud Computing


View Course

Included with Pro+ Subscription


View Course

Included with Pro+ Subscription


View Course

Included with Pro+ Subscription
.png)
View Course

Included with Pro+ Subscription


.png)


View Course

Included with Pro+ Subscription


View Course

Included with Pro+ Subscription
.png)

View Course

Included with Pro+ Subscription
.jpg)

.jpg)

.png)

View Course

Included with Pro+ Subscription


Cyber Security

View Course

Included with Pro+ Subscription

View Course

Included with Pro+ Subscription
.png)
View Course

Included with Pro+ Subscription
.png)
View Course

Included with Pro+ Subscription
.png)
View Course

Included with Pro+ Subscription
Subscribe to Academy Pro+ & get exclusive features
$25/month
No credit card required

Learn from 40+ Pro courses
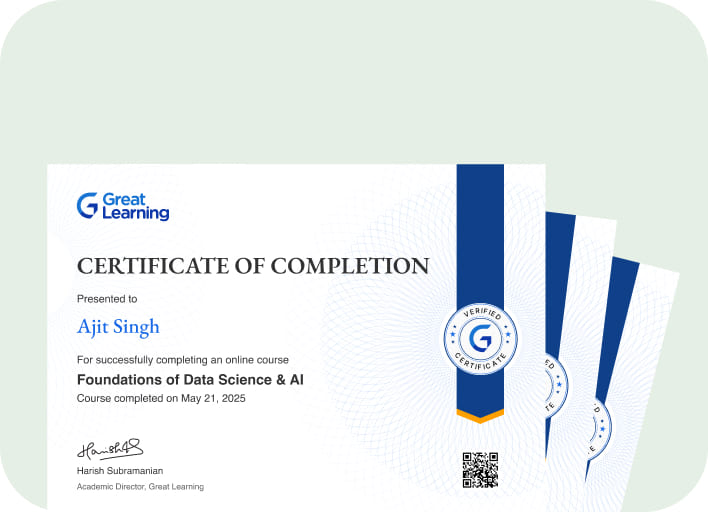
Access 500+ certificates for free
700+ Practice exercises & guided projects
Prep with AI mock interviews & resume builder
Recommended Free Machine Learning courses
.jpg)

View Course

Similar courses you might like


View Course
Related Machine Learning Courses
-
Personalized Recommendations
Placement assistance
Personalized mentorship
Detailed curriculum
Learn from world-class faculties
50% Average salary hike -


Johns Hopkins University
Certificate Program in AI Business Strategy10 weeks · Online
Know More
-


Walsh College
MS in Artificial Intelligence & Machine Learning2 Years · Online
Know More
-


MIT Professional Education
No Code AI and Machine Learning: Building Data Science Solutions12 Weeks · Online · Weekend
Learn from MIT FacultyKnow More
Relevant Career Paths >
Python Matplotlib Library
Matplotlib library in Python is a low-level graph plotting tool that serves as a visualization utility. It is an open-source library and can be used for free. The major part of the tool is written in Python. A few pieces are written in C, Objective-C, and JavaScript to support platform compatibility.
The Matplotlib is a library used to plot points, lines, and others for Python programming language and the numerical mathematics extension NumPy. It provides an object-oriented API for embedding plots into applications through general-purpose GUI toolkits, such as Tkinter, wxPython, Qt, or GTK. Pylab is a procedural interface based on state machines such as OpenGL, structured closely resembling MATLAB, although it is highly discouraged. Matplotib is used in SciPy.
John D. designed Matplotib. It is a NumFOCUS fiscally sponsored developed project. It is distributed under a BSD-style license and has an active development community.
Matplotlib 2.0.x is supported by Python versions 2.7 by 3.10. Matplotlib 1.2 has been supported by Python 3 from its start. Python 2.6 is supported by Matplotlib 1.4 for its latest version.
Matplotlib Comparison with MATLAB
Matplotlib’s module, Pyplot, provides a MATLAB kind of interface. It is designed to work like MATLAB, along with the ability to use Python. The better advantage is that it is open-source and can be used for free.
ToolKits
There are several toolkits available to extend Matplotlib functionality. A few are downloaded separately, while the others are available along with the Matplotlib source code, but they have external dependencies.
- Basemap: Basemap is a map plotting with different map projections, coastlines, and political boundaries.
- Cartopy: Cartopy is a mapping library that features object-oriented map projection definitions and arbitrary point, line, polygon. It also has image transformation capabilities.
- Excel Tools: Excel tools contains the utilities required for data exchange with Microsoft Excel.
- GTK Tools: GTK tools provide an interface to the GTK library.
- Qt interface
- Mplot3d: It is used to draw 3-D plots.
- Natgrid: Natgrid is an interface to the library to grind irregularly spaced data.
- Matplotlib2tikz: This helps in exporting to Pgfplots for easy integration into LaTex documents.
- Seaborn: Seaborn provides an API on top of the Matplotlib. It offers reasonable choices for the elements, such as plot style and color defaults, defines simple high-level functions for general statistical plot types, and integrates with Pandas' functionality.
Matplotlib Related Projects:
- Biggles
- Chaco
- DISLIN
- GNU Octave
- Gnuplot-py
- PLplot - It is a Python binding.
- PyCha - It is a libcairo implementation.
- PyPlotter - It is compatible with Jython.
- SageMath - It uses Matplotlib to draw the plots.
- SciPy - Modules plt and gplt
- wxPython - Module wx.lib.plot.py
- Plotly - It is used for interactive, online Matplotlib and Python graphs.
- Bokeh - It is a Python interactive visualization library that targets non-traditional web browsers for presentation.
Great Learning provides its learners with an opportunity to learn the Python Matplotlib course for free online. This tutorial will take you across the various subjects related to the Matplotlib used for Python programming, such as single lines, multiple lines, charts, graphs, style and code, and various other things. At the end of the Python Matplotlib course, you will be able to work efficiently with all the elements in the library, use its tools to build efficient applications. Enroll in Great Learning today to learn the Python Matplotlib course for free with millions of learners across the globe. Happy Learning!


