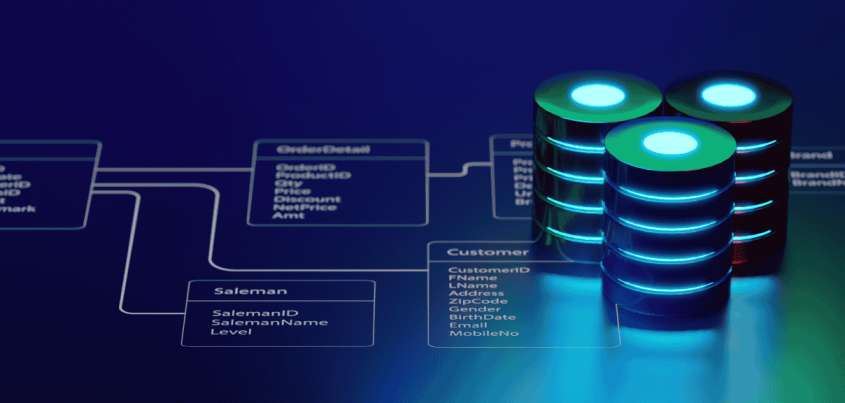
Foundations of Data Visualization using Tableau

Enhance your Business Intelligence skills with this Data Visualization using Tableau free course. Learn about Tableau, its product family, interface, and dashboard in detail with this beginner's course.

Instructor:

Vivekanand R
4.52
average rating

Ratings

Beginner

Level

3.0 Hrs

Learning hours

5.5K+
local_fire_department

Learners

Course with completion certificate

blue-tick

Stand out to recruiters

blue-tick

Share on professional channels

blue-tick

Globally recognized

Foundations of Data Visualization using Tableau

3.0 Learning Hours . Beginner

Skills you’ll Learn

About this course

This free course aims at empowering you in Data Visualization in Tableau. Data visualization is an effective tool in any industry as it allows for quick and easy analysis of complex data sets. The course starts by discussing business intelligence, data visualization, and the tools involved. Further, you will be introduced to Tableau, its product family, data types, interface, and dashboard. Lastly, you will go through the hands-on session on Tableau visualization examples on visual analytics and dashboard to help you understand it better. 


Hop onto the opportunity to learn Data Science from the best by enrolling in Great Learning's Data Science Courses. Enroll in programs that support your job goals and earn certificates that will boost your resume's worth.

Why upskill with us?

check circle outline
1000+ free courses
In-demand skills & tools
access time
Free life time Access

Course Outline

What is business intelligence?

Business Intelligence is a process of using raw data to get valuable business insights. This module introduces you to Business Intelligence and helps you understand its effects on your business, and you will also learn about its various features.
 

What is data visualization?

Data visualization is the process of creating visual representations of data to gain insights and understanding, and this module aims at introducing it to learners. You will also learn about its importance and use in business.
 

Data visualization tools

Nowadays, businesses are more into business intelligence and data visualization, dragging data visualization tools into the picture. This module focuses on the most popular data visualization tools like Tableau, Power BI, and Excel.  
 

What is tableau?

Tableau is a software program that authorizes users to create visual representations of data. This module introduces you to Tableau and explains its features along with its architecture.
 

Tableau product family

This module focuses on the standard products Tableau provides, and you will get a brief overview of these products.
 

Tableau installation

In order to work with Tableau, you must first have it on your system. Thus, this module gives you information on installing Tableau on your system.

Tableau data types

Data types are the types associated with variables that hold data. This module aims to introduce you to the data types available in Tableau.
 

Tableau Interface

This module contains a demo that familiarizes you with the Tableau interface. You will also know to connect Tableau with data sources or import data.

Tableau Dashboard

This module familiarizes you with the Tableau Dashboard, and you will learn about reports and visuals in Tableau.

Demo- visual analytics

This module contains a demo of the visual analytics of Tableau. You will learn about visualizing various charts like a bar chart, line chart, histograms, and pie chart through Tableau.
 

Demo- Dashboards

You are already introduced to the Tableau dashboard in one of the previous modules. This module will give you better clarity through the demo on creating a dashboard in Tableau. 
 

Our course instructor

instructor img

Vivekanand R

Industry Expert in Visualization

learner icon
5.5K+ Learners
video icon
1 Courses

Trusted by 10 Million+ Learners globally

What our learners say about the course

Find out how our platform helped our learners to upskill in their career.

4.52
Course Rating
69%
22%
6%
1%
2%

What our learners enjoyed the most

Course with completion certificate

blue-tick

Stand out to recruiters

blue-tick

Share on professional channels

blue-tick

Globally recognized

Foundations of Data Visualization using Tableau

3.0 Learning Hours . Beginner

Frequently Asked Questions

What are the prerequisites required to learn this Data Visualization using Tableau course?

There are no prerequisites required to learn this Tableau course. It is a beginner's course that can be attained by any learner who wishes to get started with Data Visualization using Tableau.
 

How long does completing this free Data Visualization using Tableau course take?

This free course has two hours of video content containing multiple demos. The learners are free to take it at their comfortable pace and complete the course.
 

Will I have lifetime access to the free course?

You can revisit this free Data Visualization using Tableau course whenever the need arises. 
 

What are my next learning options after this Data Visualization using Tableau course?

You can enroll in Great Learning's Data Science and Analytics course Texas McCombs offers.


Is it worth learning Data Visualization using Tableau?

Tableau is a powerful data visualization tool that can create attractive and informative visualizations. While there is a learning curve associated with using Tableau, it is definitely worth learning if you are interested in data visualization.
 

What is Data Visualization using Tableau used for?

Data Visualization using Tableau is used to create interactive visualizations of data sets with the help of graphics and charts. It allows users to explore and understand data in a better way.
 

Why is Data Visualization using Tableau so popular?

The reasons for its popularity are:


1) Tableau is very user-friendly and has a low learning curve compared to other data visualization platforms.

2) It provides a wide variety of pre-built visualizations that can be easily customized to fit the user's needs.

3) It is relatively affordable compared to other data visualization platforms.
 

What jobs demand that you learn Data Visualization using Tableau?

Jobs like Data Analyst, Business Intelligence Analyst, Data Scientist, Market Research Analyst, and Market Analyst might demand that you have knowledge of Data Visualization in Tableau.
 

Will I get a certificate after completing this Data Visualization using Tableau course?

Yes, you can achieve a free Tableau certificate by completing all the modules and the quiz at the end of the course.
 

What knowledge and skills will I gain upon completing this Data Visualization using Tableau course?

Through this free course by Great Learning, you will gain data visualization, Tableau, and Data Science skills.
 

How much does this Data Visualization using Tableau course cost?

This is a free course, and learners don't have to pay any cost to enroll in the course.
 

Is there a limit on how many times I can take this Data Visualization using Tableau course?

No, there is no limit on the number of times you can access this free course. You can revisit this course at any time to improve your knowledge of Data Visualization in Tableau.
 

Why choose Great Learning for this Data Visualization using Tableau course?

Great Learning Academy is known for offering free courses for learners ranging from students to professionals with industry-level skills. This free Data Visualization using Tableau course is rich with hands-on sessions to help you grasp it better.
 

Who is eligible to take this Data Visualization using Tableau course?

This free course is well-designed, keeping novices as targets. Hence, any beginner can learn from this free Tableau course. 
 

What are the steps to enroll in this course?

  • Search for the free course "Data Visualization using Tableau" using the search bar at the top corner of Great Learning Academy.
  • Register for this free course by clicking the enroll button on the page and start learning.

Recommended Free Data Science courses

Free
Data Analytics using Excel
course card image

Free

Beginner

Free
Applications of Data Science & Machine Learning
course card image

Free

INTERMEDIATE

Free
Linear Discriminant Analysis Applications
course card image

Free

INTERMEDIATE

Free
Autocorrelation in Data Science
course card image

Free

Beginner

Similar courses you might like

Free
Data Science with Python
course card image

Free

Beginner

Free
HR Database Management System
course card image

Free

Beginner

Free
Measures of Dispersion
course card image

Free

Beginner

Free
Principal Component Analysis
course card image

Free

INTERMEDIATE

Related Data Science Courses

50% Average salary hike
Explore degree and certificate programs from world-class universities that take your career forward.
Personalized Recommendations
checkmark icon
Placement assistance
checkmark icon
Personalized mentorship
checkmark icon
Detailed curriculum
checkmark icon
Learn from world-class faculties

Other Data Science tutorials for you

Enrol for Free