- Great Learning
- Free Courses
- It & Software

Earn a certificate & get recognized
Excel Dashboards for Business Analytics
Ready to elevate your business analytics skills? Enrol now in our free Excel Dashboards for Business Analytics course. Gain hands-on experience and transform raw data into actionable insights.
Instructor:
Madhur SinghExcel Dashboards for Business Analytics
14K+ learners enrolled so far
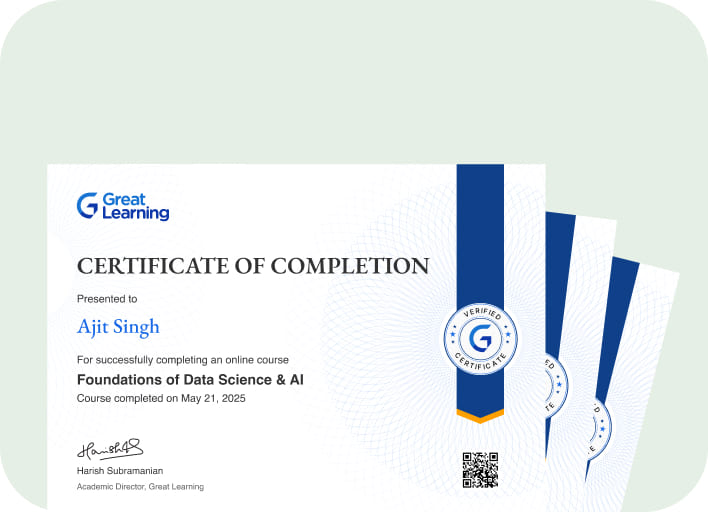
Stand out with an industry-recognized certificate
10,000+ certificates claimed, get yours today!
Get noticed by top recruiters
Share on professional channels
Globally recognised
Land your dream job

Skills you will gain
Pivot Tables
Data Cleaning
Functions
Key Highlights
Get free course content
Master in-demand skills & tools
Test your skills with quizzes
About this course
Gain a solid foundation in data management as you explore the significance of Excel Dashboards and the critical role of data cleaning for accuracy. Delve into the world of functions pivot tables and learn to build impactful dashboards, all while mastering the art of visualizing data and finding meaningful insights.
Elevate your analytical skills and transform raw data into valuable insights to drive informed business decisions. Join us on this journey to unlock the full potential of Excel for effective business analytics.
Course outline
Introduction to Excel Dashboards
Explore the fundamentals of Excel Dashboards and their pivotal role in business analytics.
Importance of Data Cleaning
Understand the critical importance of data cleaning for accurate and meaningful insights.
Types of Functions in Excel
Discover various types of functions in Excel to enhance data manipulation and analysis skills.
Pivot Tables - Excel
Master the art of Pivot Tables in Excel for dynamic and interactive data summarization.
Building Excel Dashboards
Gain hands-on experience in building effective Excel Dashboards for impactful business communication.
Organizing Data in Excel
Learn advanced techniques for organizing and structuring data in Excel to streamline analytics workflows.
Get access to the complete curriculum once you enroll in the course
Stand out with an industry-recognized certificate
10,000+ certificates claimed, get yours today!
Get noticed by top recruiters
Share on professional channels
Globally recognised
Land your dream job

Excel Dashboards for Business Analytics

2.25 Hours
Beginner
14K+ learners enrolled so far
Get free course content
Master in-demand skills & tools
Test your skills with quizzes
Refer and earn
Get learning discounts up to $20
Learner reviews of the Free Courses
5.0
4.0
5.0

5.0
5.0
What our learners enjoyed the most
Skill & tools
63% of learners found all the desired skills & tools
Our course instructor

Madhur Singh
Career Growth Expert
IT & Software Expert
Frequently Asked Questions
Will I receive a certificate upon completing this free course?
Is this course free?
What prerequisites are required to enrol in this Free Excel Dashboards for Business Analytics course?
You do not need any prior knowledge to enrol in this Excel Dashboards for Business Analytics course.
How long does it take to complete this Free Excel Dashboards for Business Analytics course?
It is a 1.0 hour long course, but it is self-paced. Once you enrol, you can take your own time to complete the course.
Will I have lifetime access to the free course?
Yes, once you enrol in the course, you will have lifetime access to any of the Great Learning Academy’s free courses. You can log in and learn whenever you want to.
Will I get a certificate after completing this Free Excel Dashboards for Business Analytics course?
Yes, you will get a certificate of completion after completing all the modules and cracking the assessment.
How much does this Excel Dashboards for Business Analytics course cost?
It is an entirely free course from Great Learning Academy.
Is there any limit on how many times I can take this free course?
No. There is no limit. Once you enrol in the Free Excel Dashboards for Business Analytics course, you have lifetime access to it. So, you can log in anytime and learn it for free online.
Who is eligible to take this Free Excel Dashboards for Business Analytics course?
You do not need any prerequisites to take the course, so enroll today and learn it for free online.
Become a Skilled Professional with Pro Courses
Gain work-ready skills with guided projects, top faculty and AI tools, all at an affordable price.


View Course

Included with Pro+ Subscription

View Course

Included with Pro+ Subscription
.jpg)
View Course

Included with Pro+ Subscription


View Course

Included with Pro+ Subscription


View Course

Included with Pro+ Subscription

View Course

Included with Pro+ Subscription

View Course

Included with Pro+ Subscription

View Course

Included with Pro+ Subscription

View Course

Included with Pro+ Subscription

View Course

Included with Pro+ Subscription

View Course

Included with Pro+ Subscription
.jpg)
View Course

Included with Pro+ Subscription

View Course

Included with Pro+ Subscription


View Course

Included with Pro+ Subscription


View Course

Included with Pro+ Subscription


View Course

Included with Pro+ Subscription

View Course

Included with Pro+ Subscription


View Course

Included with Pro+ Subscription


View Course

Included with Pro+ Subscription


.jpg)
View Course

Included with Pro+ Subscription
.png)
View Course

Included with Pro+ Subscription

View Course

Included with Pro+ Subscription

View Course

Included with Pro+ Subscription

View Course

Included with Pro+ Subscription

View Course

Included with Pro+ Subscription

View Course

Included with Pro+ Subscription

View Course

Included with Pro+ Subscription

View Course

Included with Pro+ Subscription


View Course

Included with Pro+ Subscription

View Course

Included with Pro+ Subscription
View Course

Included with Pro+ Subscription
.png)
View Course

Included with Pro+ Subscription

View Course

Included with Pro+ Subscription

View Course

Included with Pro+ Subscription

View Course

Included with Pro+ Subscription

View Course

Included with Pro+ Subscription

View Course

Included with Pro+ Subscription
View Course

Included with Pro+ Subscription
.jpg)
View Course

Included with Pro+ Subscription
.jpg)
View Course

Included with Pro+ Subscription
.jpeg)
View Course

Included with Pro+ Subscription
.jpg)
View Course

Included with Pro+ Subscription
.png)
View Course

Included with Pro+ Subscription


View Course

Included with Pro+ Subscription


View Course

Included with Pro+ Subscription


View Course

Included with Pro+ Subscription
.png)
View Course

Included with Pro+ Subscription
.jpg)

.jpg)

.png)

View Course

Included with Pro+ Subscription


View Course

Included with Pro+ Subscription

View Course

Included with Pro+ Subscription

View Course

Included with Pro+ Subscription

View Course

Included with Pro+ Subscription
.png)
View Course

Included with Pro+ Subscription
.png)
View Course

Included with Pro+ Subscription
.png)
View Course

Included with Pro+ Subscription
Popular


View Course

Included with Pro+ Subscription

View Course

Included with Pro+ Subscription
.jpg)
View Course

Included with Pro+ Subscription


View Course

Included with Pro+ Subscription


View Course

Included with Pro+ Subscription

View Course

Included with Pro+ Subscription

View Course

Included with Pro+ Subscription

View Course

Included with Pro+ Subscription
AI & Generative AI

View Course

Included with Pro+ Subscription

View Course

Included with Pro+ Subscription

View Course

Included with Pro+ Subscription
.jpg)
View Course

Included with Pro+ Subscription

View Course

Included with Pro+ Subscription


View Course

Included with Pro+ Subscription


Microsoft Courses


View Course

Included with Pro+ Subscription


View Course

Included with Pro+ Subscription


View Course

Included with Pro+ Subscription


View Course

Included with Pro+ Subscription


View Course

Included with Pro+ Subscription


IT & Software
.jpg)
View Course

Included with Pro+ Subscription
.png)
View Course

Included with Pro+ Subscription

View Course

Included with Pro+ Subscription

View Course

Included with Pro+ Subscription

View Course

Included with Pro+ Subscription

View Course

Included with Pro+ Subscription

View Course

Included with Pro+ Subscription

View Course

Included with Pro+ Subscription

View Course

Included with Pro+ Subscription
.png)
View Course

Included with Pro+ Subscription
.png)
View Course

Included with Pro+ Subscription

View Course

Included with Pro+ Subscription

View Course

Included with Pro+ Subscription

View Course

Included with Pro+ Subscription

View Course

Included with Pro+ Subscription

View Course

Included with Pro+ Subscription


View Course

Included with Pro+ Subscription

View Course

Included with Pro+ Subscription

View Course

Included with Pro+ Subscription


View Course

Included with Pro+ Subscription


View Course

Included with Pro+ Subscription
 (1).png)
View Course

Included with Pro+ Subscription
Data Science & ML


View Course

Included with Pro+ Subscription

View Course

Included with Pro+ Subscription

View Course

Included with Pro+ Subscription
.png)
View Course

Included with Pro+ Subscription

View Course

Included with Pro+ Subscription

View Course

Included with Pro+ Subscription
Management

View Course

Included with Pro+ Subscription

View Course

Included with Pro+ Subscription

View Course

Included with Pro+ Subscription

View Course

Included with Pro+ Subscription
.jpg)
View Course

Included with Pro+ Subscription
.jpg)
View Course

Included with Pro+ Subscription
.jpeg)
View Course

Included with Pro+ Subscription
.jpg)
View Course

Included with Pro+ Subscription
.png)
View Course

Included with Pro+ Subscription
.png)
View Course

Included with Pro+ Subscription
.png)
View Course

Included with Pro+ Subscription

View Course

Included with Pro+ Subscription
.png)
View Course

Included with Pro+ Subscription
.png)
View Course

Included with Pro+ Subscription
 (1).jpg)
View Course

Included with Pro+ Subscription
.png)
View Course

Included with Pro+ Subscription
Cloud Computing


View Course

Included with Pro+ Subscription


View Course

Included with Pro+ Subscription


View Course

Included with Pro+ Subscription
.png)
View Course

Included with Pro+ Subscription
.jpg)

.jpg)

.png)

View Course

Included with Pro+ Subscription


View Course

Included with Pro+ Subscription

View Course

Included with Pro+ Subscription
.png)


.png)

View Course

Included with Pro+ Subscription


Cyber Security

View Course

Included with Pro+ Subscription

View Course

Included with Pro+ Subscription
.png)
View Course

Included with Pro+ Subscription
.png)
View Course

Included with Pro+ Subscription
.png)
View Course

Included with Pro+ Subscription
Subscribe to Academy Pro+ & get exclusive features
$25/month
No credit card required

Learn from 40+ Pro courses
Access 500+ certificates for free
700+ Practice exercises & guided projects

Prep with AI mock interviews & resume builder
Recommended Free Data Science courses


Similar courses you might like


Relevant Career Paths >
Excel Dashboards for Business Analytics
Excel dashboards are powerful tools for business analytics, providing a visual representation of complex data sets to help businesses make informed decisions. These dashboards leverage the capabilities of Microsoft Excel to transform raw data into meaningful insights, making it easier for stakeholders to grasp key metrics and trends. Here's an exploration of Excel dashboards for business analytics, highlighting their significance and key features.
Significance of Excel Dashboards:
Data Visualization: Excel dashboards excel at transforming numerical data into visual representations such as charts, graphs, and tables. This visual format allows for quick comprehension of trends, patterns, and outliers, enabling faster decision-making.
User-Friendly Interface: Excel is a widely used spreadsheet software, and its familiarity makes it accessible to users at various skill levels. Dashboards built in Excel leverage this user-friendly interface, making it easier for non-technical stakeholders to interact with and interpret the data.
Customization and Flexibility: Excel dashboards offer a high degree of customization, allowing users to tailor visuals to their specific needs. This flexibility ensures that the dashboard aligns with the unique requirements and preferences of each business or individual.
Real-time Data Analysis: Businesses operate in a dynamic environment, and real-time data analysis is crucial for making timely decisions. Excel dashboards can be designed to update automatically, providing users with the most recent information without manual intervention.
Key Features of Excel Dashboards for Business Analytics:
Interactive Charts and Graphs: Excel supports a variety of chart types, including bar charts, line graphs, pie charts, and more. These visuals can be made interactive, allowing users to explore data by hovering over data points, zooming in on specific time frames, or filtering data categories.
Key Performance Indicators (KPIs): Dashboards often feature KPIs, providing a concise snapshot of the most critical metrics for a business. Whether it's revenue, customer satisfaction, or any other key performance indicator, Excel dashboards make it easy to monitor and track these metrics.
Conditional Formatting: To draw attention to important trends or outliers, dashboards can utilize conditional formatting. This feature allows cells to change appearance based on predefined conditions, making it visually apparent when certain thresholds are met or exceeded.
Data Tables and Pivot Tables: Excel dashboards can incorporate data tables and pivot tables, offering a more detailed view of underlying data. These tables can be linked to visual elements, allowing users to explore the raw data behind the graphs and charts.
Slicers and Filters: Slicers and filters provide users with the ability to interactively explore data subsets. By selecting specific criteria, users can dynamically update the dashboard to focus on relevant information.
Dashboard Navigation: For more extensive dashboards, it's essential to have a well-organized navigation system. Excel allows for the creation of hyperlinks and buttons, facilitating seamless movement between different sections of the dashboard.
In conclusion, Excel dashboards for business analytics offer a compelling solution for transforming data into actionable insights. Their significance lies in their ability to present complex information in an accessible and visually appealing manner. With features such as interactive charts, KPIs, and customizable elements, Excel dashboards empower businesses to make informed decisions and drive success in a rapidly changing business landscape.


