Master of Data Science (Global) Program
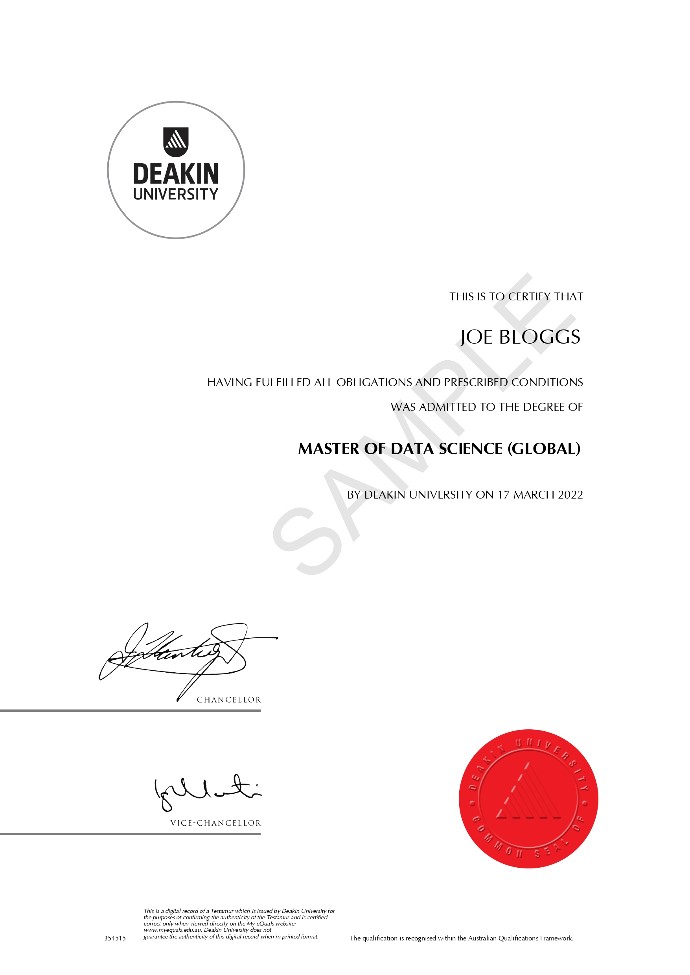
Learn Data Science from the world-class faculty through live virtual classes. Earn a globally recognized Master of Data Science Degree from Deakin University, and PG Certificates from the University of Texas at Austin.
- Online
- Hands on projects
- 1/10th degree cost
- WES Accredited
Program in collaboration with:
Earn your masters degree from
Top 1% of Universities globally (QS 2025)
Victorian Government Award 2020
World Education Services (WES) Recognized
Why choose this program?
A Global Masters Degree
-
Gain the recognition of a global masters degree from an internationally-recognised university
-
Get a global masters degree at 1/10th the cost as compared to a 2-year masters.
Learn from World-Class Faculty
-
Live Virtual Classes by Deakin Faculty
-
Curriculum designed in a modular structure - foundational and advanced competency track
Practical, Hands-on learning
-
Industry sessions and competency courses delivered by experts and faculty at Deakin University
-
Hands-on Projects
Masters from a top 1% of universities ranked globally
Triple crown accreditation AACSB, AMBA, EQUIS
Dedicated Program & Career Assistance by Great Learning
Become industry-ready with mentorship from experts
Thousands of Careers Empowered
Our alumni work in leading companies
Master of Data Science (Global) Program from Deakin University
Online | 12 Month PGP + 12 Month Masters
Learning Path
0 month
Step 1
Learners will join the Post Graduate Program by University of Texas at Austin and receive the PG certificate upon program completion.
12 month
Step 2
Post completion of the PG Program from University of Texas at Austin, candidates will continue their learning journey with the 12-month online Master of Data Science (Global) from Deakin University.
24 month
Step 3
Successful learners will receive the Master of Data Science (Global) from Deakin University at 1/10th the cost.
With globally-recognised credentials from leading universities, graduates of the Master of Data Science (Global) from Deakin University become prime candidates for accelerated career progression in the data science field.
Get The Deakin University Advantage
-
On-campus Graduation Ceremony in Australia
Opportunity to attend a graduation ceremony (optional) at the Deakin University campus in Melbourne.
-
Connect with your Alumni Community
Join the alumni portal with over 300,000 Deakin graduates, reconnect, and meet with fellow alumni across the globe.
-
Deakin Credentials
Enrolled students get access to Deakin email IDs.
-
Deakin Alumni Discount*
Deakin alumni are eligible to receive a 10% reduction per unit on enrolment fees on any postgraduate award course at Deakin.
*Terms and Conditions apply
Curriculum
The Master of Data Science Program curriculum consists of foundational and advanced competency tracks that enable learners to master advanced data science skill sets effectively.
Data Science Foundations
The Foundations block comprises five courses where we get our hands dirty with the introduction to Data Science, Statistics, Code, SQL Programming, and some domain-specific knowledge head-on. These courses set our foundations so that we sail through the rest of the journey with minimal hindrance.
- Descriptive Statistics
- Introduction to Probability
- Probability Distributions
- Hypothesis Testing and Estimation
- Goodness of Fit
Descriptive Statistics is a statistical method in Data Science that summarizes and describes the data using mean, median, etc., in tables and charts. In this module, you will learn how to use this method to understand data much more straightforward.
Probability is a mathematical tool used to study randomness, like the possibility of an event occurring in a random experiment. In this module, you will learn about Probability which is used in Business Analytics.
A statistical function reporting all the probable values that a random variable takes within a specific range is known as a Probability Distribution. This module will teach you about Probability Distributions and various types like Binomial, Poisson, and Normal Distribution.
This module will teach you about Hypothesis Testing and Estimation. Hypothesis Testing and Estimation is a necessary procedure in Applied Statistics for doing experiments based on the observed/surveyed data.
The Goodness of Fit testing is a type of Hypothesis Testing in statistics, which is used to check how adequately the sample fits a distribution from a set of observations like the population with a normal distribution.
- Fundamentals of Finance
- Working Capital Management
- Capital Budgeting
- Capital Structure
Business Finance is something where you raise and manage funds by business organisations. You will go through the fundamentals of business finance in this module.
Working Capital Management is a business strategy that helps companies monitor their current assets and liabilities to maintain their efficient operations.
Capital Budgeting is a planning strategy for a business that is used for determining and evaluating significant projects and investments. In this module, you will learn about the long-term investments of an organisation like the construction of new plants, new machinery, new products, and research development projects, which requires Capital Budgeting.
Capital Structure in business finance is a method where an organisation finances its assets and liabilities using the combination of debt and equity.
- Core Concepts of Marketing
- Customer Life Time Value
Marketing is a strategy in a corporation to promote and sell your products and services to customers. You will drive through all the core concepts of marketing in a business environment.
Customer Lifetime Value (CLV) determines the customers’ net expenditure in the products and services of your business during their lifetime.
- Introduction to DBMS
- ER diagram
- Schema design
- Key constraints and basics of normalization
- Joins
- Subqueries involving joins and aggregations
- Sorting
- Independent subqueries
- Correlated subqueries
- Analytic functions
- Set operations
- Grouping and filtering
Database Management Systems (DBMS) is a software tool where you can store, edit, and organise data in your database. This module will teach you everything you need to know about DBMS.
An Entity-Relationship (ER) diagram is a blueprint that portrays the relationship among entities and their attributes. This module will teach you how to make an ER diagram using several entities and their attributes.
Schema design is a schema diagram that specifies the name of record type, data type, and other constraints like primary key, foreign key, etc. It is a logical view of the entire database.
Key Constraints are used for uniquely identifying an entity within its entity set, in which you have a primary key, foreign key, etc. Normalization is one of the essential concepts in DBMS, which is used for organising data to avoid data redundancy. In this module, you will learn how and where to use all key constraints and normalization basics.
As the name implies, a join is an operation that combines or joins data or rows from other tables based on the common fields amongst them. In this module, you will go through the types of joins and learn how to combine data.
This module will teach you how to work with subqueries/commands that involve joins and aggregations.
As the name suggests, Sorting is a technique to arrange the records in a specific order for a clear understanding of reported data. This module will teach you how to sort data in any hierarchy like ascending or descending, etc.
The inner query that is independent of the outer query is known as an independent subquery. This module will teach you how to work with independent subqueries.
The inner query that is dependent on the outer query is known as a correlated subquery. This module will teach you how to work with correlated subqueries.
A function that determines values in a group of rows and generates a single result for every row is known as an Analytic Function.
The operation that combines two or more queries into a single result is called a Set Operation. In this module, you will implement various set operators like UNION, INTERSECT, etc.
Grouping is a feature in SQL that arranges the same values into groups using some functions like SUM, AVG, etc. Filtering is a powerful SQL technique, which is used for filtering or specifying a subset of data that matches specific criteria.
- Introduction to Python
- NumPy
- Pandas
- Visualization using Python (Matplotlib & Seaborn)
- Dealing with Data using Python
Python is a widely implemented high-level programming language and has a simple, easy-to-learn syntax that highlights readability. This module teaches you all the programming fundamentals in Python, such as syntax and semantics. In the end, you will execute your first Python program.
This section will give you an in-depth understanding of exploring data sets using NumPy. NumPy, one of the most vastly implemented Python libraries, is a package for scientific computing like working with arrays.
Pandas, another vastly implemented Python library, is used to analyze and manipulate data. This section will give you an in-depth understanding of exploring data sets using Pandas.
Matplotlib, another vastly implemented Python library, is a library to create statically animated, interactive visualizations. This module will give you an in-depth understanding of exploring data sets using Matplotlib.
Seaborn is also one of the most vastly implemented Python libraries. It is a Matplotlib-based data visualization library in Python. In this module, you will gain an in-depth understanding of exploring data sets using Seaborn.
This section will give you an in-depth understanding of how to deal with data with the help of Python programming.
Data Science Techniques
The next module in this Data Analytics course is Data Science techniques. The technique block will teach us the fundamental methods used in Data Science and Analytics that will help you to approach any problem.
- Analysis of Variance
- Regression Analysis
- Dimension Reduction Techniques
Analysis of Variance, also known as ANOVA, is a statistical technique used in Data Science, which is used to split observed variance data into various components for additional analysis and tests. This module will teach you how to identify the significant differences between the means of two or more groups.
Regression Analysis is a statistical technique used to analyse the relationship between a dependent variable and one or more independent variables. In this module, you will learn several variations like linear regression, multiple linear, and non-linear regression.
Dimension Reduction transforms data from a high dimensional to low dimensional space without losing any vital information. This module will teach you how to work with various Dimension Reduction techniques in Machine Learning.
- Multiple Linear Regression
- Logistic Regression
- Linear Discriminant Analysis
Multiple Linear Regression is a supervised machine learning algorithm involving multiple data variables for analysis. It is used for predicting one dependent variable using various independent variables. This module will drive you through all the concepts of Multiple Linear Regression used in Machine Learning.
Logistic Regression is one of the most popular ML algorithms, like Linear Regression. It is a simple classification algorithm to predict the categorical dependent variables with the assistance of independent variables. This module will drive you through all the concepts of Logistic Regression used in Machine Learning.
Linear Discriminant Analysis (LDA) is a dimension reduction technique used for building machine learning models. This module will drive you through all the concepts of LDA used in supervised machine learning.
- Introduction to Supervised and Unsupervised Learning
Supervised and Unsupervised learning techniques are one of the essential learning algorithms in Machine Learning. Supervised learning models are trained using labelled data, whereas unsupervised learning models are trained using unlabelled data. - Clustering
Clustering is an unsupervised learning technique involving the grouping of data. In this module, you will learn everything you need to know about the method and its types like K-means clustering, hierarchical clustering, etc. - Decision Trees
Decision Tree is a Supervised Machine Learning algorithm used for both classification and regression problems. It is a hierarchical structure where internal nodes indicate the dataset features, branches represent the decision rules, and each leaf node indicates the result. - Random Forest
Random Forest is a popular supervised learning algorithm in machine learning. As the name indicates, it comprises several decision trees on the provided dataset’s several subsets. Then, it calculates the average for enhancing the dataset’s predictive accuracy. - Neural Networks
A Neural Network is a computing system in deep learning based on the biological neural network that makes up the human brain. In this module, you will learn all the neural networks’ applications.
- Handling Unstructured Data
Unstructured data can be images, text, etc., and in this module, you will learn how to train our model using unstructured data. - Machine Learning Algorithms
This module will drive you through all the Machine Learning algorithms’ concepts and use them for training your models. - Bias Variance trade-off
This module will drive you through all the Bias Variance trade-off concepts and how to work with the property. - Handling Unbalanced Data
Unbalanced Data or Imbalanced data is where the data is not categorised clearly. In this module, you will learn how to train your model on imbalanced data. - Boosting
As the name suggests, Boosting is a meta-algorithm in machine learning that converts robust classifiers from several weak classifiers. Boosting can be further classified as Gradient boosting and ADA boosting or Adaptive boosting. - Model Validation
This module will teach you which model best suits architecture by evaluating every individual model based on the requirements.
- Introduction to Time Series
Time-Series Analysis comprises methods for analysing data on time-series to extract meaningful statistics and other relevant information. Time-Series forecasting is used to predict future values based on previously observed values. - Correlation
This module will teach you how to solve the problems of correlation. - Forecasting
In this module, you will learn how to collect data and predict the future value of data focusing on its unique trends. This technique is known as Forecasting data. - Autoregressive models
The autoregressive model uses regressed data from the previous time series to predict future data at the next time series.
- Linear programming
Linear Programming is a mathematical modelling technique of maximising and minimising a linear function subjected to several constraints in linear equations. In this module, you will learn how to work with Linear Programming in Business Analytics. - Goal Programming
Goal Programming is an optimization technique to solve multi-objective optimization problems. In this module, you will learn how to work with Goal Programming in Business Analytics. - Integer Programming
Integer Programming is a Linear Programming method where the variables are restricted to integers. This module will teach you how to work with Integer Programming. - Mixed Integer Programming
Linear programming is used to maximise or minimise a linear function subjected to several constraints. Mixed-integer programming adds one additional condition. The condition is that at least one of the variables must take on only integer values. - Distribution and Network Models
This module will drive you through all the essentials necessary to learn about Distribution and Network Models.
Domain exposure
Moving ahead with the next topic in the Data Analytics course, this Domain Exposure block will provide a gateway into real-life problems of varied domains and teach how to solve these problems using Data Science and Analytics principles.
- Overview of ChatGPT and OpenAI
- Timeline of NLP and Generative AI
- Frameworks for understanding ChatGPT and Generative AI
- Implications for work, business, and education
- Output modalities and limitations
- Business roles to leverage ChatGPT
- Prompt engineering for fine-tuning outputs
- Practical demonstration and bonus section on RLHF
- Marketing and Retail Terminologies
Marketing analytics is the process of measuring, managing, and analysing marketing performance to maximise effectiveness and optimise return on investment. Retail analytics is the process of analysing business trends and performance on inventory levels, supply chain movement, consumer demand, sales, etc. This module will teach you how to analyse the performance of a business using data science and business analytics. - Customer Analytics
Customer Analytics is the process of analysing how customers help to make critical business decisions via predictive analytics, data visualisation, information management, and segmentation. - KNIME
KNIME stands for the Konstanz Information Miner. It is an open-source data analytics, reporting, and integration platform, where it incorporates several machine learning and data mining components and provides software for data preprocessing and data analysis. This module will teach you how to use KNIME software to create and increase data science production, enabling you to focus on what you do the best. - Retail Dashboard
Retail Dashboard is a tool to track the performance of your business in sales and marketing. This module will help you to work with the tool to track the insights. - Customer Churn
Customer Churn is the percentage of customers who stopped doing business with a company’s products and services over a certain period of time. In this module, you will learn how to track the customers’ analysis who stopped doing business with you. - Association Rules Mining
Association Rules Mining in Data Mining is a method that identifies relationships amongst variables in large sets of databases. This module will help you understand how to identify patterns amongst variables.
- Web Analytics: Understanding the metrics
Web Analytics is the measurement of your Internet data by collecting, analysing, and reporting it to optimise and enhance your web pages. In this module, you will learn how to optimise your data on web pages. - Basic & Advanced Web Metrics
In this module, you will learn how to track the performance and statistics to better a website from fundamental to advanced methods. - Google Analytics: Demo & Hands on
Google Analytics is one of the most useful analytics tools in the Data Analytics industry, helping you track website traffic. As Google search engine is most widely used by everyone, most companies use Google analytics as their Web Analytics service to analyse their website traffic and performance. This module will teach you how to work with Google Analytics using hands-on demos. - Campaign Analytics
Campaign Analytics analyses data from various marketing campaigns like blogs, social media campaigns (YouTube, Instagram, Twitter), email, etc. This module will make you learn how to analyse data from various campaigns. - Text Mining
In this module, you will learn how to convert unstructured text into a structured text to discover relevant insights. This method is known as Text Data Mining.
- Why Credit Risk-Using a market case study
Credit Risk arises when a borrower fails to repay any debts or loans. This module will teach you how to manage credit risk. - Comparison of Credit Risk Models
This module will make you learn all the vital comparisons of various credit risk models. - Overview of Probability of Default (PD) Modeling
Probability of Default (PD) Modeling provides an estimation of the probability that a borrower cannot meet its debt responsibilities. - PD Models, types of models, Steps to make a good model
In this module, you will learn about the PD model and other models that are available. You will also learn the procedure to make a good model. - Market Risk
Market Risk arises when an investor faces losses due to external factors affecting the market prices. In this module, you will learn about market risk management. - Value at Risk - using stock case study
Value at Risk (VaR) is a statistical method to measure the company’s financial risk over a certain period of time.
- Introduction to Supply Chain
As the name implies, the supply chain is a network between a company and its suppliers for the distribution of a product to the final customer/buyer. - RNNs and its mechanisms
An artificial neural network that uses sequential data or time-series data is known as a Recurrent Neural Network. It can be used for language translation, natural language processing (NLP), speech recognition, and image captioning. This module will teach you how to apply RNN in supply chain management. - Designing Optimal Strategy using Case Study
This module will help you design an optimal strategy for the supply chain and logistic analytics using a case study. - Inventory Control & Management
Inventory control is a technique to control and maximise inventory in the company’s warehouses. Inventory management is an approach to track your inventory of sourcing, buying, and selling of goods. - Inventory classification
As the name suggests, Inventory classification is the process of categorising your goods in an inventory system according to their demands, revenues, supply, etc. - Inventory Modeling
Inventory Modelling is a mathematical model to determine the most favourable level of inventories in a company. This module will teach you how to maintain inventory in the production, manage the frequency of stock, quality control, etc. - Costs Involved in Inventory
In this module, you will learn about the costs involved in inventory management. - Economic Order Quantity
Economic Order Quantity (ECQ) is a method to minimise or reduce inventory costs. - Forecasting
In this module, you will learn how to collect data and predict the future value of data focusing on its unique trends. This technique is known as Forecasting data. - Advanced Forecasting Methods
In this module, you will understand the working of advanced forecasting methods and learn how to apply them in supply chain management and logistics analytics. - Examples & Case Studies
In this module, you will make your hands dirty with various examples and case studies of supply chain management and logistics analytics.
Visualization and insights
Visualization and insights are the last topics in this Data Science and Business Analytics online course. This block will help you represent data in the best ways for easy consumption and quick derivation of insights using Tableau.
- Introduction to Data Visualization
The process of the graphical representation of data and information is known as Data Visualization. This module will teach you how to use data visualization tools for providing data trends and patterns. - Introduction to Tableau
Tableau is the most widely used data visualization tool to solve problems. This module will teach you everything you need to know about Tableau. - Basic charts and dashboard
In this module, you will learn how to create a Tableau dashboard and charts to organise data. - Descriptive Statistics, Dimensions and Measures
The study of data analysis by describing and summarising several data sets is known as Descriptive Analysis. It can either be a sample of a region’s population or the marks achieved by 50 students. This module will help you understand Descriptive Statistics, Dimensions, and Measures in Tableau. - Visual analytics: Storytelling through data
Visual Analytics is the science of analytical reasoning, which is supported by interactive visual interfaces. - Dashboard design & principles
This module will teach you how to design a Tableau dashboard and various dashboard principles. - Advanced design components/ principles : Enhancing the power of dashboards
This module will make you understand advanced design principles and components and learn how to enhance the power of dashboards. - Special chart types
In this module, you will learn about various types of charts in Tableau like Line Chart, Bar Chart, Pie Chart, etc. - Case Study: Hands on using Tableau
In this module, you will make your hands full with the implementation of Tableau using a case study. - Integrate Tableau with Google Sheets
This module will teach you how to integrate Tableau on Google Sheets.
PROGRAM CURRICULUM FOR MASTER OF DATA SCIENCE (GLOBAL)
Python Bootcamp for Non-Programmers
This bootcamp serves as a training module for learners with limited or no programming exposure to enable them to be at par with other learners with prior programming knowledge before the course commencement. This is an optional but open to all module. More than 1000 Learners have used this successfully to create a strong foundation of programming knowledge, needed to succeed as an AI ML professional.
Foundations
The Foundations block comprises of two courses where we get our hands dirty with Statistics and Code, head-on. These two courses set our foundations so that we sail through the rest of the journey with minimal hindrance.
- Python Basics
Python is a widely used high-level programming language and has a simple, easy-to-learn syntax that highlights readability. This module will help you drive through all the fundamentals of programming in Python, and at the end, you will execute your first Python program. - Jupyter notebook – Installation & function
You will learn to implement Python for AI and ML using Jupyter Notebook. This open-source web application allows us to create and share documents containing live code, equations, visualisations, and narrative text. - Python functions, packages and routines
Functions and Packages are used for code reusability and program modularity, respectively. This module will help you understand and implement Functions and Packages in Python for AI. - Pandas, NumPy, Matplotlib, Seaborn
This module will give you a deep understanding of exploring data sets using Pandas, NumPy, Matplotlib, and Seaborn. These are the most widely used Python libraries. - Working with data structures,arrays, vectors & data frames
Data Structures are one of the most significant concepts in any programming language. They help in the arrangement of leader-board games by ranking each player. They also help in speech and image processing for AI and ML. In this module, you will learn Data Structures like Arrays, Lists, Tuples, etc. and learn to implement Vectors and Data Frames in Python.
- Descriptive Statistics
The study of data analysis by describing and summarising several data sets is known as Descriptive Analysis. It can either be a sample of a region’s population or the marks achieved by 50 students. This module will help you understand Descriptive Statistics in Python for Machine Learning. - Inferential Statistics
This module will let you explore fundamental concepts of using data for estimation and assessing theories using Python. - Probability & Conditional Probability
Probability is a mathematical tool used to study randomness like the possibility of an event occurrence in a random experiment. Conditional Probability is the possibility of an event occurring given that several other events have also occurred. In this module, you will learn about Probability and Conditional Probability in Python for Machine Learning. - Probability Distributions - Types of distribution – Binomial, Poisson & Normal distribution
A statistical function reporting all the probable values that a random variable takes within a specific range is known as a Probability Distribution. This module will teach you about Probability Distributions and various types like Binomial, Poisson, and Normal Distribution in Python. - Hypothesis Testing
This module will teach you about Hypothesis Testing in Machine Learning using Python. Hypothesis Testing is a necessary procedure in Applied Statistics for doing experiments based on the observed/surveyed data.
Machine Learning
The next module is the Machine Learning online course that will teach us all the Machine Learning techniques from scratch, and the popularly used Classical ML algorithms that fall in each of the categories.
- Multiple Variable Linear regression
Linear Regression is one of the most popular ML algorithms used for predictive analysis in Machine Learning, resulting in producing the best outcomes. It is a technique assuming a linear relationship between the independent variable and dependent variable. - Multiple regression
Multivariate Regression is a supervised machine learning algorithm involving multiple data variables for analysis. It is used for predicting one dependent variable using various independent variables. This module will drive you through all the concepts of Multiple Regression used in Machine Learning. - Logistic regression
Logistic Regression is one of the most popular ML algorithms, like Linear Regression. It is a simple classification algorithm to predict the categorical dependent variables with the assistance of independent variables. This module will drive you through all the concepts of Logistic Regression used in Machine Learning. - K-NN classification
k-NN Classification or k-Nearest Neighbours Classification is one of the most straightforward machine learning algorithms for solving regression and classification problems. You will learn about the usage of this algorithm through this module. - Naive Bayes classifiers
Naive Bayes Algorithm is used to solve classification problems using Baye’s Theorem. This module will teach you about the theorem and solving the problems using it. - Support vector machines
Support Vector Machine or SVM is also a popular ML algorithm used for regression and classification problems/challenges. You will learn how to implement this algorithm through this module.
- K-means clustering
K-means clustering is a popular unsupervised learning algorithm to resolve the clustering problems in Machine Learning or Data Science. In this module, you will learn how the algorithm works and later implement it. - Hierarchical clustering
Hierarchical Clustering is an ML technique or algorithm to build a hierarchy or tree-like structure of clusters. For example, it is used to combine a list of unlabeled datasets into a cluster in the hierarchical structure. This module will teach you the working and implementation of this algorithm. - High-dimensional clustering
High-dimensional Clustering is the clustering of datasets by gathering thousands of dimensions. - Dimension Reduction-PCA
Principal Component Analysis for Dimensional Reduction is a technique to reduce the complexity of a model like eliminating the number of input variables for a predictive model to avoid overfitting. Dimension Reduction-PCA is a well-known technique in Python for ML, and you will learn everything about this method in this module.
- Decision Trees
Decision Tree is a Supervised Machine Learning algorithm used for both classification and regression problems. It is a hierarchical structure where internal nodes indicate the dataset features, branches represent the decision rules, and each leaf node indicates the result. - Random Forests
Random Forest is a popular supervised learning algorithm in machine learning. As the name indicates, it comprises several decision trees on the provided dataset’s several subsets. Then, it calculates the average for enhancing the dataset’s predictive accuracy. - Bagging
Bagging, also known as Bootstrap Aggregation, is a meta-algorithm in machine learning used for enhancing the stability and accuracy of machine learning algorithms, which are used in statistical classification and regression. - Boosting
As the name suggests, Boosting is a meta-algorithm in machine learning that converts robust classifiers from several weak classifiers. Boosting can be further classified as Gradient boosting and ADA boosting or Adaptive boosting.
- Feature engineering
Feature engineering is transforming data from the raw state to a state where it becomes suitable for modelling. It converts the data columns into features that are better at representing a given situation in terms of clarity. Quality of the component in distinctly representing an entity impacts the model’s quality in predicting its behaviour. In this module, you will learn several steps involved in Feature Engineering. - Model selection and tuning
This module will teach you which model best suits architecture by evaluating every individual model based on the requirements. - Model performance measures
In this module, you will learn how to optimise your machine learning model’s performance using model evaluation metrics. - Regularising Linear models
In this module, you will learn the technique to avoid overfitting and increase model interpretability. - ML pipeline
This module will teach you how to automate machine learning workflows using the ML Pipeline. You can operate the ML Pipeline by enabling a series of data to be altered and linked together in a model, which can be tested and evaluated to achieve either a positive or negative result. - Bootstrap sampling
Bootstrap Sampling is a machine learning technique to estimate statistics on population by examining a dataset with replacement. - Grid search CV
Grid search CV is the process of performing hyperparameter tuning to determine the optimal values for any machine learning model. The performance of a model significantly depends on the importance of hyperparameters. Doing this process manually is a tedious task. Hence, we use GridSearchCV to automate the tuning of hyperparameters. - Randomized search CV
Randomized search CV is used to automate the tuning of hyperparameters similar to Grid search CV. Randomized search CV is provided for a random search, and Grid search CV is provided for a grid search. - K fold cross-validation
K-fold cross-validation is a way in ML to improve the holdout method. This method guarantees that our model’s score does not depend on how we picked the train and test set. The data set is divided into k number of subsets, and the holdout method is repeated k number of times.
- Introduction to DBMS
- ER diagram
- Schema design
- Key constraints and basics of normalization
- Joins
- Subqueries involving joins and aggregations
- Sorting
- Independent subqueries
- Correlated subqueries
- Analytic functions
- Set operations
- Grouping and filtering
Database Management Systems (DBMS) is a software tool where you can store, edit, and organise data in your database. This module will teach you everything you need to know about DBMS.
An Entity-Relationship (ER) diagram is a blueprint that portrays the relationship among entities and their attributes. This module will teach you how to make an ER diagram using several entities and their attributes.
Schema design is a schema diagram that specifies the name of record type, data type, and other constraints like primary key, foreign key, etc. It is a logical view of the entire database.
Key Constraints are used for uniquely identifying an entity within its entity set, in which you have a primary key, foreign key, etc. Normalization is one of the essential concepts in DBMS, which is used for organising data to avoid data redundancy. In this module, you will learn how and where to use all key constraints and normalization basics.
As the name implies, a join is an operation that combines or joins data or rows from other tables based on the common fields amongst them. In this module, you will go through the types of joins and learn how to combine data.
This module will teach you how to work with subqueries/commands that involve joins and aggregations.
As the name suggests, Sorting is a technique to arrange the records in a specific order for a clear understanding of reported data. This module will teach you how to sort data in any hierarchy like ascending or descending, etc.
The inner query that is independent of the outer query is known as an independent subquery. This module will teach you how to work with independent subqueries.
The inner query that is dependent on the outer query is known as a correlated subquery. This module will teach you how to work with correlated subqueries.
A function that determines values in a group of rows and generates a single result for every row is known as an Analytic Function.
The operation that combines two or more queries into a single result is called a Set Operation. In this module, you will implement various set operators like UNION, INTERSECT, etc.
Grouping is a feature in SQL that arranges the same values into groups using some functions like SUM, AVG, etc. Filtering is a powerful SQL technique, which is used for filtering or specifying a subset of data that matches specific criteria.
Artificial Intelligence
The next module is the Artificial Intelligence online course that will teach us from the introduction to Artificial Intelligence to taking us beyond the traditional ML into Neural Nets’ realm. We move on to training our models with Unstructured Data like Text and Images from the regular tabular data.
- AI VS ML VS DL VS GenAI
- Supervised Vs Unsupervised Learning
- Discriminative VS Generative AI
- A brief timeline of GenAI
- Basics of Generative Models
- Large language models
- Word vectors
- Attention Mechanism
- Business applications of ML, DL and GenAI
- Hands-on Bing Images and ChatGPT
- What is a prompt?
- What is prompt engineering?
- Why is prompt engineering significant?
- How are outputs from LLMs guided by prompts?
- Limitations and Challenges with LLMs
- Broad strategies for prompt design
- Template Based prompts
- Fill in the blanks prompts
- Multiple choice prompts
- Instructional prompts
- Iterative prompts
- Ethically aware prompts
- Best practices for effective prompt design
- Gradient Descent
Gradient Descent is an iterative process that finds the minima of a function. It is an optimisation algorithm that finds the parameters or coefficients of a function’s minimum value. However, this function does not always guarantee to find a global minimum and can get stuck at a local minimum. In this module, you will learn everything you need to know about Gradient Descent. - Introduction to Perceptron & Neural Networks
Perceptron is an artificial neuron, or merely a mathematical model of a biological neuron. A Neural Network is a computing system based on the biological neural network that makes up the human brain. In this module, you will learn all the neural networks’ applications and go much deeper into the perceptron. - Batch Normalization
Normalisation is a technique to change the values of numeric columns in the dataset to a standard scale, without distorting differences in the ranges of values. In Deep Learning, rather than just performing normalisation once in the beginning, you’re doing it all over the network. This is called batch normalisation. The output from the activation function of a layer is normalised and passed as input to the next layer. - Activation and Loss functions
Activation Function is used for defining the output of a neural network from several inputs. Loss Function is a technique for prediction error of neural networks. - Hyper parameter tuning
This module will drive you through all the concepts involved in hyperparameter tuning, an automated model enhancer provided by AI training. - Deep Neural Networks
An Artificial Neural Network (ANN) having several layers between the input and output layers is known as a Deep Neural Network (DNN). You will learn everything about deep neural networks in this module. - Tensor Flow & Keras for Neural Networks & Deep Learning
TensorFlow is created by Google, which is an open-source library for numerical computation and wide-ranging machine learning. Keras is a powerful, open-source API designed to develop and evaluate deep learning models. This module will teach you how to implement TensorFlow and Keras from scratch. These libraries are widely used in Python for AIML.
- Introduction to Image data
This module will teach you how to process the image and extract all the data from it, which can be used for image recognition in deep learning. - Introduction to Convolutional Neural Networks
Convolutional Neural Networks (CNN) are used for image processing, classification, segmentation, and many more applications. This module will help you learn everything about CNN. - Famous CNN architectures
In this module, you will learn everything you need to know about several CNN architectures like AlexNet, GoogLeNet, VGGNet, etc. - Transfer Learning
Transfer learning is a research problem in deep learning that focuses on storing knowledge gained while training one model and applying it to another model. - Object detection
Object detection is a computer vision technique in which a software system can detect, locate, and trace objects from a given image or video. Face detection is one of the examples of object detection. You will learn how to detect any object using deep learning algorithms in this module. - Semantic segmentation
The goal of semantic segmentation (also known as dense prediction) in computer vision is to label each pixel of the input image with the respective class representing a specific object/body. - Instance Segmentation
Object Instance Segmentation takes semantic segmentation one step ahead in a sense that it aims towards distinguishing multiple objects from a single class. It is considered as a Hybrid of Object Detection and Semantic Segmentation tasks. - Other variants of convolution
This module will drive you several other essential variants in Convolutional Neural Networks (CNN). - Metric Learning
Metric Learning is a task of learning distance metrics from supervised data in a machine learning manner. It focuses on computer vision and pattern recognition. - Siamese Networks
A Siamese neural network (sometimes called a twin neural network) is an artificial neural network that contains two or more identical subnetworks which means they have the same configuration with the same parameters and weights. This module will help you find the similarity of the inputs by comparing the feature vectors of subnetworks. - Triplet Loss
In learning a projection where the inputs can be distinguished, the triplet loss is similar to metric learning. The triplet loss is used for understanding the score vectors for the images. You can use the score vectors of face descriptors for verifying the faces in Euclidean Space.
- Introduction to NLP
Natural language processing applies computational linguistics to build real-world applications that work with languages comprising varying structures. We try to teach the computer to learn languages, and then expect it to understand it, with suitable, efficient algorithms. This module will drive you through the introduction to NLP and all the essential concepts you need to know. - Preprocessing text data
Text preprocessing is the method to clean and prepare text data. This module will teach you all the steps involved in preprocessing a text like Text Cleansing, Tokenization, Stemming, etc. - Bag of Words Model
Bag of words is a Natural Language Processing technique of text modelling. In technical terms, we can say that it is a method of feature extraction with text data. This approach is a flexible and straightforward way of extracting features from documents. In this module, you will learn how to keep track of words, disregard the grammatical details, word order, etc. - TF-IDF
TF is the term frequency (TF) of a word in a document. There are several ways of calculating this frequency, with the simplest being a raw count of instances a word appears in a document. IDF is the inverse document frequency(IDF) of the word across a set of documents. This suggests how common or rare a word is in the entire document set. The closer it is to 0, the more common is the word. - N-grams
An N-gram is a series of N-words. They are broadly used in text mining and natural language processing tasks. - Word2Vec
Word2vec is a method to create word embeddings by using a two-layer neural network efficiently. It was developed by Tomas Mikolov et al. at Google in 2013 to make the neural-network-based training of the embedding more efficient and since then has become the de facto standard for developing pre-trained word embedding. - GLOVE
GloVe (Global Vectors for Word Representation) is an unsupervised learning algorithm, which is an alternate method to create word embeddings. It is based on matrix factorisation techniques on the word-context matrix. - POS Tagging & Named Entity Recognition
We have learned the differences between the various parts of speech tags such as nouns, verbs, adjectives, and adverbs in elementary school. Associating each word in a sentence with a proper POS (part of speech) is known as POS tagging or POS annotation. POS tags are also known as word classes, morphological classes, or lexical tags. NER, short for, Named Entity Recognition is a standard Natural Language Processing problem which deals with information extraction. The primary objective is to locate and classify named entities in text into predefined categories such as the names of persons, organisations, locations, events, expressions of times, quantities, monetary values, percentages, etc. - Introduction to Sequential models
A sequence, as the name suggests, is an ordered collection of several items. In this module, you will learn how to predict what letter or word appears using the Sequential model in NLP. - Need for memory in neural networks
This module will teach you how critical is the need for memory in Neural Networks. - Types of sequential models – One to many, many to one, many to many
In this module, you will go through all the types of Sequential models like one-to-many, many-to-one, and many-to-many. - Recurrent Neural networks (RNNs)
An artificial neural network that uses sequential data or time-series data is known as a Recurrent Neural Network. It can be used for language translation, natural language processing (NLP), speech recognition, and image captioning. - Long Short Term Memory (LSTM)
LSTM is a type of Artificial Recurrent Neural Network that can learn order dependence in sequence prediction problems. - GRU
Great Recurrent Unit (GRU) is a gating mechanism in RNN. You will learn all you need to about the mechanism in this module. - Applications of LSTMs
You will go through all the significant applications of LSTM in this module. - Sentiment analysis using LSTM
An NLP technique to determine whether the data is positive, negative, or neutral is known as Sentiment Analysis. The most commonly used example is Twitter. - Time series analysis
Time-Series Analysis comprises methods for analysing data on time-series to extract meaningful statistics and other relevant information. Time-Series forecasting is used to predict future values based on previously observed values. - Neural Machine Translation
Neural Machine Translation (NMT) is a task for machine translation that uses an artificial neural network, which automatically converts source text in one language to the text in another language. - Advanced Language Models
This module will teach several other widely used and advanced language models used in NLP.
- Overview of ChatGPT and OpenAI
- Timeline of NLP and Generative AI
- Frameworks for understanding ChatGPT and Generative AI
- Implications for work, business, and education
- Output modalities and limitations
- Business roles to leverage ChatGPT
- Prompt engineering for fine-tuning outputs
- Practical demonstration and bonus section on RLHF
Gain an understanding of what ChatGPT is and how it works, as well as delve into the implications of ChatGPT for work, business, and education. Additionally, learn about prompt engineering and how it can be used to fine-tune outputs for specific use cases.
- Mathematical Fundamentals for Generative AI
- VAEs: First Generative Neural Networks
- GANs: Photorealistic Image Generation
- Conditional GANs and Stable Diffusion: Control & Improvement in Image Generation
- Transformer Models: Generative AI for Natural Language
- ChatGPT: Conversational Generative AI
- Hands-on ChatGPT Prototype Creation
- Next Steps for Further Learning and understanding
Dive into the development stack of ChatGPT by learning the mathematical fundamentals that underlie generative AI. Further, learn about transformer models and how they are used in generative AI for natural language.
Additional Modules
This block will teach some additional modules involved in this Python for AIML online course.
- Data, Data Types, and Variables
This module will drive you through some essential data types and variables. - Central Tendency and Dispersion
Central tendency is expressed by median and mode. Dispersion is described by data that is distributed around this central tendency. Dispersion is represented by a range, deviation, variance, standard deviation and standard error. - 5 point summary and skewness of data
5 point summary is a large set of descriptive statistics, which provides information about a dataset. Skewness characterises the degree of asymmetry of a distribution around its mean. - Box-plot, covariance, and Coeff of Correlation
This module will teach you how to solve the problems of Box-plot, Covariance, and Coefficient of Correlation using Python. - Univariate and Multivariate Analysis
Univariate Analysis and Multivariate Analysis are used for statistical comparisons. - Encoding Categorical Data
You will learn how to encode and transform categorical data using Python in this module. - Scaling and Normalization
In Scaling, you change the range of your data. In normalisation, you change the shape of the distribution of your data. - What is Preprocessing?
The process of cleaning raw data for it to be used for machine learning activities is known as data pre-processing. It’s the first and foremost step while doing a machine learning project. It’s the phase that is generally most time-taking as well. In this module, you will learn why is preprocessing required and all the steps involved in it. - Imputing missing values
Missing values results in causing problems for machine learning algorithms. The process of identifying missing values and replacing them with a numerical value is known as Data Imputation. - Working with Outliers
An object deviating notably from the rest of the objects, is known as an Outlier. A measurement or execution error causes an Outlier. This module will teach you how to work with Outliers. - "pandas-profiling" Library
The pandas-profiling library generates a complete report for a dataset, which includes data type information, descriptive statistics, correlations, etc.
- Introduction to forecasting data
In this module, you will learn how to collect data and predict the future value of data focusing on its unique trends. This technique is known as Forecasting data. - Definition and properties of Time Series data
This module will teach you about the introduction of time series data and cover all the time-series properties. - Examples of Time Series data
You will learn some real-time examples of time series data in this module. - Features of Time Series data
You will learn some essential features of time series data in this module. - Essentials for Forecasting
In this module, you will go through all the essentials required to perform Forecasting of your data. - Missing data and Exploratory analysis
Exploratory Data Analysis, or EDA, is essentially a type of storytelling for statisticians. It allows us to uncover patterns and insights, often with visual methods, within data. In this module, you will learn the basics of EDA with an example. - Components of Time Series data
In this module, you will go through all the components required for Time-series data. - Naive, Average and Moving Average Forecasting
Naive Forecasting is the most basic technique to forecast your data like stock prices. Whereas, Moving Average Forecasting is a technique to predict future value based on past values. - Decomposition of Time Series into Trend, Seasonality and Residual
This module will teach you how to decompose the time series data into Trend, Seasonality and Residual. - Validation set and Performance Measures for a Time Series model
In this module, you will learn how to evaluate your machine learning models on time series data by measuring their performance and validation them. - Exponential Smoothing method
A time series forecasting method used for univariate data is known as the Exponential Smoothing method, one of the most efficient forecasting methods. - ARIMA Approach
ARIMA stands for Auto Regression Integrated Moving Average and is used to forecast time series following a seasonal pattern and a trend. It has three key aspects, namely: Auto Regression (AR), Integration (I), and Moving Average (MA).
- Mathematics for Deep Learning (Linear Algebra)
This module will drive you through all the essential concepts like Linear Algebra required for implementing Mathematicsto implement mathematics. - Functions and Convex optimization
Convex Optimization is like the heart of most of the ML algorithms. It prefers studying the problem of minimising convex functions to convex sets. This module will teach you how to use all the functions and convex optimisation for your ML algorithms. - Loss Function
Loss Function is a technique for prediction error of neural networks. - Introduction to Neural Networks and Deep Learning
This module will teach you everything you need to know about the introduction to Neural Networks and Deep Learning.
- Model Serialization
Serialization is a technique to convert data structures or object state into a format like JSON, XML, which can later be stored or transmitted and reconstructed. - Updatable Classifiers
This module will teach you how to use updatable classifiers for machine learning models. - Batch mode
Batch mode is a network roundtrip-reduction feature. It is used to batch up data-related operations to perform them in coarse-grained chunks. - Real-time Productionalization (Flask)
In this module, you will learn how to improve your Machine Learning model’s productivity Using Flask. - Docker Containerization - Developmental environment
Docker is one of the most popular tools to create, deploy, and run applications with the help of containers. Using containers, you can package up an application with all the necessary parts like libraries and other dependencies, and ship it all together as one package. - Docker Containerization - Productionalization
In this module, you will learn how to improve the productivity of deploying your Machine Learning models. - Kubernetes
Kubernetes is a tool similar to Docker that is used to manage and handle containers. In this module, you will learn how to deploy your models using Kubernetes.
- Callbacks
Callbacks are powerful tools that help customise a Keras model’s behaviour during training, evaluation, or inference. - Tensorboard
TensorBoard is a free and open-source tool that provides measurements and visualizations required during the machine learning workflow. This module will teach you how to use the TensorBoard library using Python for Machine Learning. - Graph Visualization and Visualizing weights, bias & gradients
In this module, you will learn everything you need to know about Graph Visualization and Visualizing weights, bias & gradients. - Hyperparameter tuning
This module will drive you through all the concepts involved in hyperparameter tuning, an automated model enhancer provided by AI training. - Occlusion experiment
Occlusion experiment is a method to determine which image patches contribute to the maximum level to the output of a neural network. - Saliency maps
A saliency map is an image, which displays each pixel’s unique quality. This module will cover how to use a saliency map in deep learning. - Neural style transfer
Neural style transfer is an optimization technique that takes two images, a content image and a style reference image, later blends them together. Now, the output image resembles the content image but displayed in the style of the style reference image.
- Introduction to GANs
Generative adversarial networks, also known as GANs, are deep generative models. Like most generative models they use a differential function represented by a neural network known as a Generator network. GANs also consist of another neural network called Discriminator network. This module covers everything about the introduction to GANs. - Autoencoders
Autoencoder is a type of neural network where the output layer has the same dimensionality as the input layer. In simpler words, the number of output units in the output layer is equal to the number of input units in the input layer. An autoencoder replicates the input to the output in an unsupervised manner and is sometimes referred to as a replicator neural network. - Deep Convolutional GANs
Deep Convolutional GANs works as both Generator and Discriminator. You will learn how to use Deep Convolutional GANs with an example. - How to train and common challenges in GANs
In this module, you will learn how to train GANs and identify common challenges in GANs. - Semi-supervised GANs
The Semi-Supervised GAN is used to address semi-supervised learning problems. - Practical Application of GANs
In this module, you will learn all the essential and practical applications of GANs.
- What is reinforcement learning?
We need technical assistance to simplify life, improve productivity and to make better business decisions. To achieve this goal, we need intelligent machines. While it is easy to write programs for simple tasks, we need a way to build machines that carry out complex tasks. To achieve this is to create machines that are capable of learning things by themselves. Reinforcement learning does this. - Reinforcement learning framework
You will learn some essential frameworks used for Reinforcement learning in this module. - Value-based methods - Q-learning
The ‘Q’ in Q-learning stands for quality. It is an off-policy reinforcement learning algorithm, which always tries to identify the best action to take provided the current state. - Exploration vs Exploitation
Here, you will discover all the key differences between Exploration and Exploitation used in Reinforcement learning. - SARSA
SARSA stands for State-Action-Reward-State-Action. It is an on-policy reinforcement learning algorithm, which always tries to identify the best action to take from another state. - Q Learning vs SARSA
Here, you will discover all the key differences between Q Learning and SARSA used in Reinforcement learning.
- Introduction to Recommendation systems: You would gain a basic understanding of Recommendation Systems.
- Content based recommendation system: You would learn the techniques to filter the content and recommend the best products.
- Popularity based model: You would learn the techniques of popularity-based filtering of the recommendations.
- Collaborative filtering (User similarity & Item similarity): collaborative filtering is a process of making automatic predictions of the interests of a user by collecting preferences or taste information from several users. You would learn the techniques of collaborative-based filtering of the recommendations.
- Hybrid models Hybrid systems blend neural networks and Machine Learning techniques to recognize the patterns in a given dataset. They are rigorously employed in solving the problems of deep learning.
Below are the various concepts of Recommendation systems you would master
PROGRAM CURRICULUM FOR MASTER OF DATA SCIENCE (GLOBAL)
ENGINEERING AI SOLUTIONS
- Explain the process and key characteristics of developing an AI solution, and the contrast with traditional software development, to inform a range of stakeholders
- Design, develop, deploy, and maintain AI solutions utilising modern tools, frameworks, and libraries
- Apply engineering principles and scientific method with appropriate rigour in conducting experiments as part of the AI solution development process
- Manage expectations and advise stakeholders on the process of operationalising AI solutions from concept inception to deployment and ongoing product maintenance and evolution
MATHEMATICS FOR ARTIFICIAL INTELLIGENCE
- Explain the role and application of mathematical concepts associated with artificial intelligence
- Identify and summarise mathematical concepts and technique covered in the unit needed to solve mathematical problems from artificial intelligence applications
- Verify and critically evaluate results obtained and communicate results to a range of audiences
- Read and interpret mathematical notation and communicate the problem-solving approach used
MACHINE LEARNING
- Use Python for writing appropriate codes to solve a given problem
- Apply suitable clustering/dimensionality reduction techniques to perform unsupervised learning on unlabelled data in a real-world scenario
- Apply linear and logistic regression/classification and use model appraisal techniques to evaluate develop models
- Use the concept of KNN (k-nearest neighbourhood) and SVM (support vector machine) to analyse and develop classification models for solving real-world problems
- Apply decision tree and random forest models to demonstrate multi-class classification models
- Implement model selection and compute relevant evaluation measure for a given problem
MODERN DATA SCIENCE
- Develop knowledge of and discuss new and emerging fields in data science
- Describe advanced constituents and underlying theoretical foundation of data science
- Evaluate modern data analytics and its implication in real-world applications
- Use appropriate platform to collect and process relatively large datasets
- Collect, model and conduct inferential as well predictive tasks from data
REAL-WORLD ANALYTICS
- Apply knowledge of multivariate functions data transformations and data distributions to summarise data sets
- Analyse datasets by interpreting summary statistics, model and function parameters
- Apply game theory, and linear programming skills and models, to make optimal decisions
- Develop software codes to solve computational problems for real world analytics
- Demonstrate professional ethics and responsibility for working with real world data
DATA WRANGLING
- Undertake data wrangling tasks by using appropriate programming and scripting languages to extract, clean, consolidate, and store data of different data types from a range of data sources
- Research data discovery and extraction methods and tools and apply resulting learning to handle extracting data based on project needs
- Design, implement, and explain the data model needed to achieve project goals, and the processes that can be used to convert data from data sources to both technical and non-technical audiences
- Use both statistical and machine learning techniques to perform exploratory analysis on data extracted, and communicate results to technical and non-technical audiences
- Apply and reflect on techniques for maintaining data privacy and exercising ethics in data handling
Languages and Tools
Data Science And Business Analytics Pathway
Artificial Intelligence and Machine Learning Pathway
Faculty
Dr. Kumar Muthuraman
Professor, McCombs School of Business, UT Austin
McCombs School of Business, University of Texas at Austin
Dr. Sutharshan Rajasegarar
Senior Lecturer in Computer Science Course Director Master of Data Science
Dr. Abhinanda Sarkar
Academic Director - Data Science & Machine Learning
Mr. R Vivekanand
Co-Founder and Director
Wilson Consulting Private Limited
Prof. Raghavshyam Ramamurthy
Industry Expert in Visualization
Dr. Ye Zhu
Senior Lecturer, Computer Science
Dr. Bahareh Nakisa
Senior Lecturer, Applied Artificial Intelligence
Dr. Asef Nazari
Senior Lecturer in Mathematics for Artificial Intelligence
Gang Li
Professor,School of Info Technology
Dr. Marek Gagolewski
Senior Lecturer, Applied Artificial Intelligence
Maia Angelova Turkedjieva
Professor, Real-World Analytics
Get the Great Learning Advantage
Our career support program will be made available to all the learners of this program.
50%
Average Salary Hike*
*Across Great Learning programs
- 50% Average Salary Hike*
*Across Great Learning programs
Resume Building Sessions
Build your resume to highlight your skill-set along with your previous academic and professional experience.
Interview preparation
Learn to crack technical interviews with our interview preparation sessions.
Career Guidance
Get access to career mentoring from industry experts. Benefit from their guidance on how to build a rewarding career.
Program Fees
Program Fees:
8,500 USD
Benefits of learning from us
- Global Masters Degree
- Live Virtual Classes by Deakin Faculty
- Gain Deakin Alumni Credentials
- World Class Curriculum
- 1/10th Fee of an On-campus Program
- Dual Certification from 2 Global Universities
- World Education Services (WES) Recognized
EMI plans EMI
plans Full fee
payment plan
Loan Amount: 7,800 USD
Admission Fees (payable on enrolment): 400 USD
Monthly Installment
Installment No. | Processing Fee | Payment |
---|---|---|
3 Month EMI | 0 | 2600 USD |
6 Month EMI | 0 | 1300 USD |
12 Month EMI | 184.8 USD | 650 USD |
18 Month EMI | 276.12 USD | 433.33 USD |
Monthly Installment
Installment No. | Processing Fee | Payment |
---|---|---|
24 Month EMI | 276.12 USD | 367.25 USD |
36 Month EMI | 276.12 USD | 258.92 USD |
48 Month EMI | 276.12 USD | 209.30 USD |
60 Month EMI | 276.12 USD | 179.40 USD |
Total Fee Payment
8,200 USD
Application Process
APPLY
Fill out an online application form
GET REVIEWED
Go through a screening call with the Admission Director’s office.
JOIN THE PROGRAM
Your profile will be shared with the Program Director for final selection
Who is this program for?
Applicant must meet Deakin’s minimum English Language requirement.
Candidates should have a bachelors degree (minimum 3-year degree program) in a related discipline OR a bachelors degree in any discipline with at least 2 years of work experience.
Upcoming Application Deadline
Our admissions close once the requisite number of participants enroll for the upcoming batch. Apply early to secure your seats.
Deadline: 20th Jan 2025
Apply NowBatch Start Dates
Online
To be announced
Frequently Asked Questions
Students will commence their journey with the PG Program in Data Science and Business Analytics (PGP-DSBA) from the McCombs School of Business at the University of Texas, Austin (UT Austin), in collaboration with Great Lakes Executive Learning for the first 12 months. Upon completing either program, they will continue their learning journey with Deakin University’s 12-month online Master of Data Science (Global) Program.
This program follows a cohort-based approach. So, students are required to finish these courses in a specified order and time period.
The duration of the program is 12+12 months, and the student’s results will be shared after 3 months of program completion.
Yes, you will receive career assistance from Great Learning, a part of BYJU’s group and India’s renowned ed-tech platform for professional development and higher education.
The career support services include:
-
E-Portfolio: The program will help students develop an outstanding E-Portfolio to showcase their expertise to potential employers.
-
Exclusive Job Board: Students will obtain access to Great Learning’s Job Board, where 12000+ organisations approach them with industry-relevant job opportunities with an average salary hike of 50%.
-
Resume Building and Interview Preparation: The program will assist students in building their top-notch resumes to highlight their skills and previous professional experience. They’ll also be able to crack interviews with the interview preparation sessions.
-
Career Guidance: Students will receive career mentorship sessions from several industry experts to build their rewarding careers.
Yes, students will get a dual advantage from the world’s leading universities and institutes after completing this program. The details are provided below:
PGP-DSBA and Master of Data Science: Suppose a student pursues the PGP-DSBA and Master of Data Science courses. In that case, they will secure Post Graduate Certificates in Data Science and Business Analytics from the University of Texas at Austin and Great Lakes Executive Learning, as well as the Master of Data Science Degree (Global) from Deakin University, Australia.
The renowned and highly experienced faculty members of UT Austin, Great Lakes and Deakin University will teach you this program and guide you through your lucrative career path in Data Science & Business Analytics.
The learning outcomes of this world-class program are as follows:
-
Students will develop a thorough understanding of how to manage the difficulties that can occur when developing Data Science solutions.
-
They will be able to apply mathematical and statistical principles to Data Science applications.
-
They will explore a variety of Data Science techniques and apply them to real-world scenarios.
-
They will be able to comprehend essential Data Science skills utilised in today’s modern world.
-
Students will work with decision-making problems by utilising real-world analytical techniques, along with the technique of Data Wrangling.
There are a lot of amazing benefits this course has got to offer you. Here are a few of them:
-
World-Class Faculty: Faculty from Deakin University, UT Austin and Great Lakes come with years of academic and industry experience to impart the latest skills effectively.
-
Hands-on Learning: Learners work on several hands-on projects and case studies to apply Data Science techniques to solve real-world business problems and a capstone project that incorporates all the tools and techniques learned throughout the course.
-
Comprehensive Curriculum: The curriculum is designed with a modular structure by unbundling the curriculum into foundational and advanced competency tracks, which enable learners to master advanced Data Science skill sets effectively.
-
Dual Advantage from World’s Leading Universities: Upon the successful completion of the Master of Data Science (Global) Program, you would receive a PG Certificate from McCombs School of Business at UT Austin and Great Lakes and a Master of Data Science (Global) Degree from Deakin University that adds value to your resumes.
The QS World University Rankings 2021 has ranked UT Austin in 6th position globally in Business Analytics. Outlook.
Deakin University has positioned itself in the top 1% of universities worldwide, as per ShanghaiRankings. According to QS World Rankings, it is ranked as one of the top 50 young universities in the world.
The Master of Data Science (Global) is a 12+12-month online program designed with a modular structure by unbundling the curriculum into foundational and advanced competency tracks, which enable learners to master advanced Data Science skill sets effectively.
The program is designed to equip students with the industry-relevant skills and knowledge required to pursue their careers in the cutting-edge fields of Data Science, Business Analytics.
The online mode of learning will furthermore let the students continue working while upgrading their skills and saving up on accommodation costs. With globally recognised credentials from leading universities (UT Austin & Deakin University), graduates of the Master of Data Science (Global) from Deakin University become prime candidates for accelerated career progression in the Data Science field.
The eligibility criteria for this program are as follows:
-
Applicants must hold a bachelor's degree (minimum 3-year program) in a related field or a bachelor's degree in any discipline with at least 2 years of professional work experience.
-
The applicants must meet Deakin University’s minimal English language requirement.
No, you are not required to attempt GRE or GMAT tests. The candidates who meet the eligibility criteria are eligible to pursue this program.
The fee to pursue this program is USD 8500, which is 1/10th the cost as compared to a traditional 2-year Master’s degree.
The program fee can be paid by candidates through net banking, credit cards, or debit cards.
There are no refund policies for this program. However, a few exceptional cases are considered at our discretion.
To enrol in this program, the candidates must meet the eligibility criteria mentioned earlier. The admission process for the eligible students is as follows:
-
Step-1: Register through an online application form.
-
Step-2: The admissions committee will analyse each applicant's profile, and those chosen will get an "Offer of Admission."
-
Step-3: By paying the registration fee for the upcoming cohort and submitting all required documents, you can reserve your seat.
Once the required number of participants has signed up for the upcoming batch, our admissions are closed. The first-come, first-serve policy applies to the few seats available for this program. To guarantee your seats, apply early.
Still have queries?
Contact Us
Please fill in the form and a Program Advisor will reach out to you. You can also reach out to us at deakin.mds@mygreatlearning.com or +1 512 890 1269.
Download Brochure
Check out the program and fee details in our brochure
Oops!! Something went wrong, Please try again.
This program is not available in your region, please visit this webpage for details of a similar program.
Continue to check out similar courses available to you
EXPLORE COURSESBrowse Related Blogs
Form submitted successfully
We are allocating a suitable domain expert to help you out with program details. Expect to receive a call in the next 4 hours.
Master of Data Science (Global) Program - Deakin University, Australia
Deakin University in Australia offers its students a top-notch education, outstanding employment opportunities, and a superb university experience. Deakin is ranked among the top 1% of universities globally (ShanghaiRankings) and is one of the top 50 young universities worldwide.
The curriculum designed by Deakin University strongly emphasises practical and project-based learning, which is shaped by industry demands to guarantee that its degrees are applicable today and in the upcoming future.
The University provides a vibrant atmosphere for teaching, learning, and research. To ensure that its students are trained and prepared for the occupations of tomorrow, Deakin has invested in the newest technology, cutting-edge instructional resources, and facilities. All the students will obtain access to their online learning environment, whether they are enrolled on campus or are only studying online.
Role of UT Austin and Great Lakes in this Master of Data Science, Deakin University
The University of Texas at Austin’s (UT Austin) McCombs School of Business and Great Lakes Executive Learning have collaborated to develop the following course:
Students must opt for either of the courses mentioned above in the 1st year of this Data Science Master’s Degree (Global) Program. These courses will familiarise them with the cutting-edge fields that are necessary for providing insights, supporting decisions, deriving business insights and gaining a competitive advantage in the modern business world.
In the 2nd year, students will continue their learning journey with Deakin University’s 12-month online Master of Data Science (Global) Program, where they will gain exposure and insights into advanced Data Science skills to prepare for the jobs of tomorrow.
Why pursue the Data Scientist Masters Program at Deakin University, Australia?
The Master's Degree from Deakin University provides a flexible learning schedule for contemporary professionals to achieve their upskilling requirements. Though it's not the sole benefit, you can also:
-
Obtain the acknowledgement of a Global Master's Degree from an internationally-recognised university, Deakin University, along with Post Graduate Certificates from the world’s well-established institutions, UT Austin and Great Lakes.
-
Learn Data Science, Business Analytics from reputed faculties with live and interactive online sessions.
-
Develop your skills by using a curriculum created by eminent academicians and industry professionals.
-
Grasp practical knowledge and skills by engaging in project-based learning.
-
Become market-ready with mentorship sessions from industry experts
-
Learn with a diverse group of peers and professionals for a rich learning experience.
-
Secure a Global Data Science Master’s Degree at 1/10th the cost compared to a 2-year traditional Master’s program.
Benefits of Deakin University Master’s Course of Data Science (Global)
Several benefits are offered throughout this online Data Science degree program, which includes:
-
PROGRAM STRUCTURE
Deakin University's 12+12-month Master of Data Science (Global) Program is built with a modular structure that separates the curriculum into basic and advanced competency tracks, allowing students to master advanced Data Science skill sets successfully with Business Analytics.
-
INDUSTRY EXPOSURE
Through industry workshops and competency classes led by professionals and faculty at Deakin University, UT Austin and Great Lakes, candidates gain exposure and insights from world-class industry experts.
-
WORLD-CLASS FACULTY
To effectively teach the latest skills in the current market, the faculty members of Deakin University, UT Austin and Great Lakes come with years of expertise in both academics and industry.
-
CAREER ENHANCEMENT SUPPORT
The program provides career development support activities to assist applicants in identifying their strengths and career paths to help them pick the appropriate competencies to study. These activities include workshops and mentorship sessions. Students will also have access to GL Excelerate, a carefully curated employment platform from Great Learning, via which they can apply for appropriate opportunities.
The Advantage of Great Learning in this Deakin University’s Master of Data Science Course
Great Learning is India’s leading and reputed ed-tech platform and a part of BYJU’s group, providing industry-relevant programs for professional learning and higher education. This course gives you access to GL Excelerate, Great Learning's comprehensive network of industry experts and committed career support.
-
E-PORTFOLIO
An e-portfolio illustrates all the skills completed and knowledge gained throughout the course that may be shared on social media. Potential employers will be able to recognise your skills through the e-portfolio.
-
CAREER SUPPORT
The course provides students with career support, empowering them to advance their professions.
-
ACCESS TO CURATED JOB BOARD
Students will acquire access to a list of curated job opportunities that match their qualifications and industry. Great Learning has partnered with 12000+ organisations through the job board, where they shared job opportunities with an average salary hike of 50%.
-
RESUME BUILDING AND INTERVIEW PREPARATION
They assist the students in creating a resume that highlights their abilities and prior work experience. With the help of their interview preparation workshops, they will also learn how to ace interviews.
-
CAREER MENTORSHIP
Acquire access to personalised career mentorship sessions from highly skilled industry experts and take advantage of their guidance to develop a lucrative career in the respective industry.
Eligibility for Master of Data Science (Global) Program
The following are the requirements for program eligibility:
-
Interested candidates must hold a bachelor's degree (minimum 3-year program) in a related field or a bachelor's degree in any discipline with at least 2 years of professional work experience.
-
Candidates must meet Deakin University’s minimal English language requirement.

Secure a Master of Data Science (Global) Degree, along with PGP-DSBA Certificates
Students will be awarded three certificates from the world’s leading and reputed institutes:
PGP-DSBA and Master of Data Science (Global)
-
Post Graduate Certificate in Data Science and Business Analytics - The University of Texas at Austin
-
Post Graduate Certificate in Data Science and Business Analytics - Great Lakes Executive Learning
-
Master of Data Science Degree (Global) from Deakin University, Australia
Hey there! Welcome back.
You are already registered. Please login instead.
Forgot your password? No problem.
You are already registered. Please login instead.
Login
Forgot Password?
Enter your registered email and we'll send you a link to change your password.