Statistical modeling is a fundamental technique used in data science, business analytics, economics, and scientific research. It involves constructing mathematical representations of real-world processes to analyze patterns, make predictions, and derive insights.
By leveraging statistical modeling methods, businesses and researchers can make informed decisions based on data rather than intuition.
Understanding Statistical Modeling
Statistical modeling is the process of using mathematical equations and statistical techniques to represent and analyze real-world phenomena. These models help in understanding relationships between variables, identifying trends, and making predictions. Statistical modeling methods typically consist of:
- Dependent Variables: The outcome or response that needs to be predicted or explained.
- Independent Variables: Factors that influence the dependent variable.
- Mathematical Equations: Expressions that describe the relationship between variables.
A statistical-based algorithm in data mining is built using historical data and tested for accuracy before being deployed for decision-making or forecasting.
Also Read: What Is Statistical Analysis and Types?
Statistical-Based Algorithms in Data Mining
Data mining involves extracting valuable patterns and insights from large datasets. Statistical-based algorithms in data mining are essential for analyzing complex data and identifying meaningful trends.
These algorithms utilize statistical models to perform classification, clustering, association, and anomaly detection. Some widely used statistical-based algorithms include:
1. Regression Analysis
Regression models are used to predict numerical outcomes based on input variables. Common types include:
- Linear Regression: Establishes relationships between independent and dependent variables.
- Logistic Regression: Used for binary classification problems, such as fraud detection.
2. Bayesian Networks
These probabilistic models use Bayes' theorem to infer relationships between variables and predict future outcomes. Bayesian networks are commonly applied in risk assessment, medical diagnosis, and recommendation systems.
3. Decision Trees and Random Forests
Decision trees classify data by splitting it into branches based on feature values. Random forests improve accuracy by combining multiple decision trees to reduce overfitting.
4. Clustering Algorithms
Clustering techniques group data points based on similarities. Examples include:
- K-Means Clustering: Assigns data points to clusters based on centroids.
- Hierarchical Clustering: Builds a tree of clusters for hierarchical relationships.
5. Principal Component Analysis (PCA)
PCA is used for dimensionality reduction, helping to simplify large datasets by identifying the most important variables.
6. Anomaly Detection Models
Statistical methods detect unusual patterns or outliers in data. These are crucial in fraud detection, network security, and quality control.
7. Association Rule Mining
This technique finds relationships between variables in large datasets. A well-known example is the Apriori algorithm, used in market basket analysis to identify product associations.
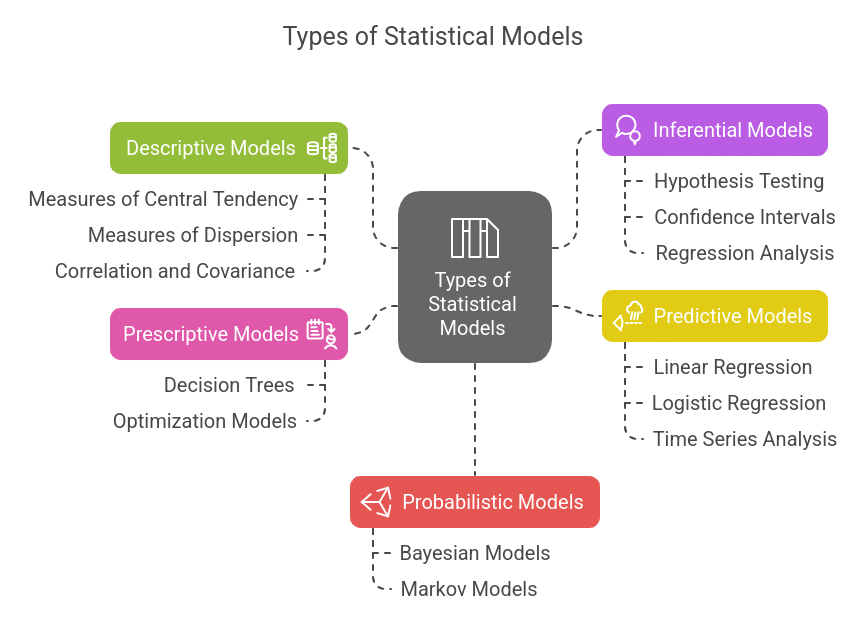
Types of Statistical Models
There are several types of statistical modeling methods, each suited for different kinds of data and analyses. Below are some of the most commonly used statistical modeling techniques:
1. Descriptive Models
Descriptive models are used to summarize and interpret the characteristics of a dataset. These models help in understanding data distribution, trends, and patterns.
Examples include:
- Measures of Central Tendency: Mean, median, and mode provide insights into data concentration.
- Measures of Dispersion: Standard deviation and variance measure the spread of data points.
- Correlation and Covariance: These indicate relationships between different variables in a dataset.
2. Inferential Models
Inferential models draw conclusions about a population based on sample data. These models are essential for statistical hypothesis testing and decision-making.
Examples include:
- Hypothesis Testing: Used to determine if there is a significant effect or relationship in the data.
- Confidence Intervals: Provide an estimated range within which the true population parameter lies.
- Regression Analysis: Used to understand relationships between variables and make predictions.
3. Predictive Models
Predictive models analyze historical data to forecast future trends or outcomes. These models are widely used in business intelligence, finance, and healthcare.
Examples include:
- Linear Regression: Predicts a dependent variable based on independent variables.
- Logistic Regression: Used for binary classification problems such as spam detection.
- Time Series Analysis: Forecasts future values based on past data trends.
4. Prescriptive Models
Prescriptive models recommend the best course of action based on data-driven insights. These models are used in optimization and decision analysis.
Examples include:
- Decision Trees: Used for classification and regression tasks by splitting data into branches.
- Optimization Models: Help businesses maximize profits or minimize costs based on constraints.
5. Probabilistic Models
Probabilistic models rely on probability distributions to describe uncertainty in data. These models are commonly used in risk assessment and finance.
Examples include:
- Bayesian Models: Utilize prior knowledge and evidence to update probability estimates.
- Markov Models: Analyze stochastic processes where the next state depends only on the current state.
Applications of Statistical Modeling
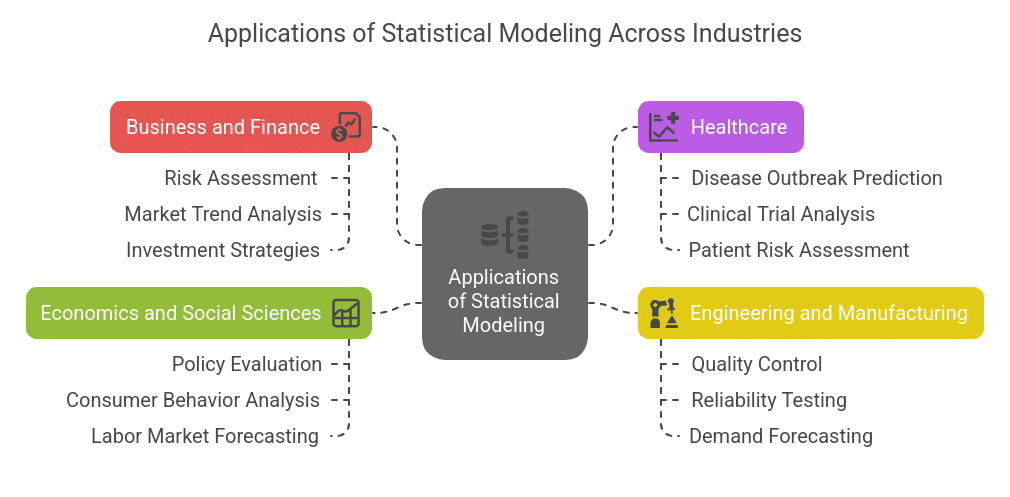
Statistical modeling is widely used across different industries to enhance decision-making and optimize operations. Below are some key applications:
1. Business and Finance
- Risk Assessment: Banks and financial institutions use statistical models to assess credit risk and fraud detection.
- Market Trend Analysis: Companies leverage statistical models to predict consumer behavior and market fluctuations.
- Investment Strategies: Portfolio optimization and stock market predictions rely on probabilistic and predictive models.
2. Healthcare
- Disease Outbreak Prediction: Statistical models are used to track and predict the spread of infectious diseases.
- Clinical Trial Analysis: Inferential models help evaluate the effectiveness of medical treatments.
- Patient Risk Assessment: Predictive modeling assists in identifying high-risk patients for early intervention.
3. Engineering and Manufacturing
- Quality Control: Statistical process control techniques help maintain product quality and consistency.
- Reliability Testing: Engineers use statistical models to estimate product lifespan and failure rates.
- Demand Forecasting: Manufacturing firms use time series analysis to predict production needs.
4. Economics and Social Sciences
- Policy Evaluation: Governments analyze economic indicators and social trends using statistical models.
- Consumer Behavior Analysis: Companies use inferential models to understand purchasing patterns and customer preferences.
- Labor Market Forecasting: Economic models help predict employment trends and wage growth.
Linear regression model in Python with code
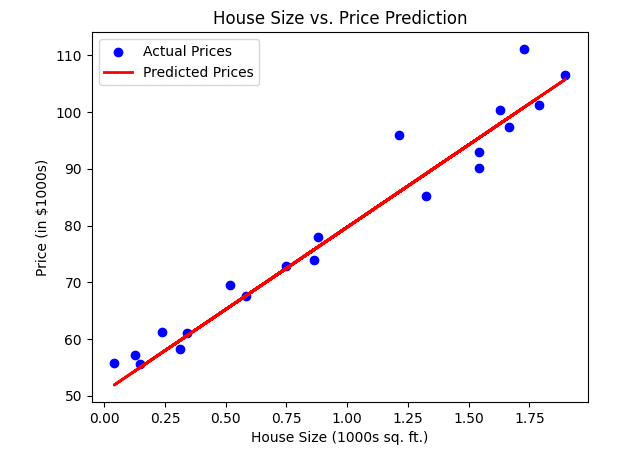
Problem Statement - A real estate company wants to predict the price of houses based on their size. They have collected historical data where each house's size (in square feet) and corresponding price (in thousands of dollars) are recorded.
The objective is to build a linear regression model that can predict the house price based on its size.
Here's the complete code for building a linear regression model to predict house prices based on size in one block:
import numpy as np
import matplotlib.pyplot as plt
from sklearn.model_selection import train_test_split
from sklearn.linear_model import LinearRegression
from sklearn.metrics import mean_squared_error

# Generate sample data (House size in 1000s sq. ft. & House price in $1000s)
np.random.seed(42)
house_size = 2 * np.random.rand(100, 1)
house_price = 50 + 30 * house_size + np.random.randn(100, 1) * 5  # Adding noise

# Split into training and testing sets
X_train, X_test, y_train, y_test = train_test_split(house_size, house_price, test_size=0.2, random_state=42)

# Train the linear regression model
model = LinearRegression()
model.fit(X_train, y_train)

# Make predictions
y_pred = model.predict(X_test)

# Evaluate the model
mse = mean_squared_error(y_test, y_pred)
print(f"Mean Squared Error: {mse:.2f}")
print(f"Intercept: {model.intercept_[0]:.2f}, Slope: {model.coef_[0][0]:.2f}")

# Visualize results
plt.scatter(X_test, y_test, color='blue', label='Actual Prices')
plt.plot(X_test, y_pred, color='red', linewidth=2, label='Predicted Prices')
plt.xlabel("House Size (1000s sq. ft.)")
plt.ylabel("Price (in $1000s)")
plt.title("House Size vs. Price Prediction")
plt.legend()
plt.show()
Expected Output
Model Parameters (Intercept & Slope)
Mean Squared Error: ~20-30  (Varies due to random noise)
Intercept: ~50.00
Slope: ~30.00
- The equation for predicting house price:
Price = 50 + 30 × (House Size in 1000 sq. ft.) - Scatter Plot
- Blue points: Actual house prices
- Red line: Model’s predicted prices
Conclusion
Statistical modeling is a powerful tool that transforms raw data into meaningful insights. From business to healthcare, its applications are vast and growing.
Understanding the different statistical modeling methods and their applications can help professionals leverage data more effectively. As data science evolves, statistical-based algorithms in data mining will play a crucial role in uncovering patterns and trends.
Master Data Science and Machine Learning in Python with 17 hours of content, 136 coding exercises, and 6 real-world projects. Gain expertise in data analysis, predictive modeling, and feature engineering.
Frequently Asked Questions
1. How is statistical modeling different from machine learning?
Statistical modeling focuses on understanding relationships between variables and making inferences based on mathematical theories, while machine learning emphasizes pattern recognition and predictive accuracy using computational algorithms.
2. What are the most common mistakes when building a statistical model?
Common mistakes include using poor-quality data, overfitting the model to training data, ignoring assumptions of the statistical method, and misinterpreting correlation as causation.
3. Can statistical modeling be used with small datasets?
Yes, statistical modeling can work with small datasets, but it requires careful selection of the right model, proper handling of assumptions, and sometimes techniques like bootstrapping to improve reliability.
4. How do you validate a statistical model?
Validation techniques include splitting data into training and testing sets, performing cross-validation, checking residual analysis, and evaluating performance metrics such as R-squared, accuracy, or AIC/BIC scores.
5. Is statistical modeling still relevant with the rise of deep learning?
Absolutely! Statistical modeling remains essential for interpretability, hypothesis testing, and situations where domain knowledge and explainability are critical, while deep learning excels in complex pattern recognition tasks.
