
In the world we live in today, where decisions are data-driven, statistical analysis is central to it all. Whether it is companies understanding consumer behavior, scientists validating new hypotheses, or health workers monitoring patterns of disease, the statistical analysis turns raw data into actionable insights.
But what exactly is statistical analysis? Why is it so important, and what different types should you know? In this article, we’ll break it all down in a simple way.
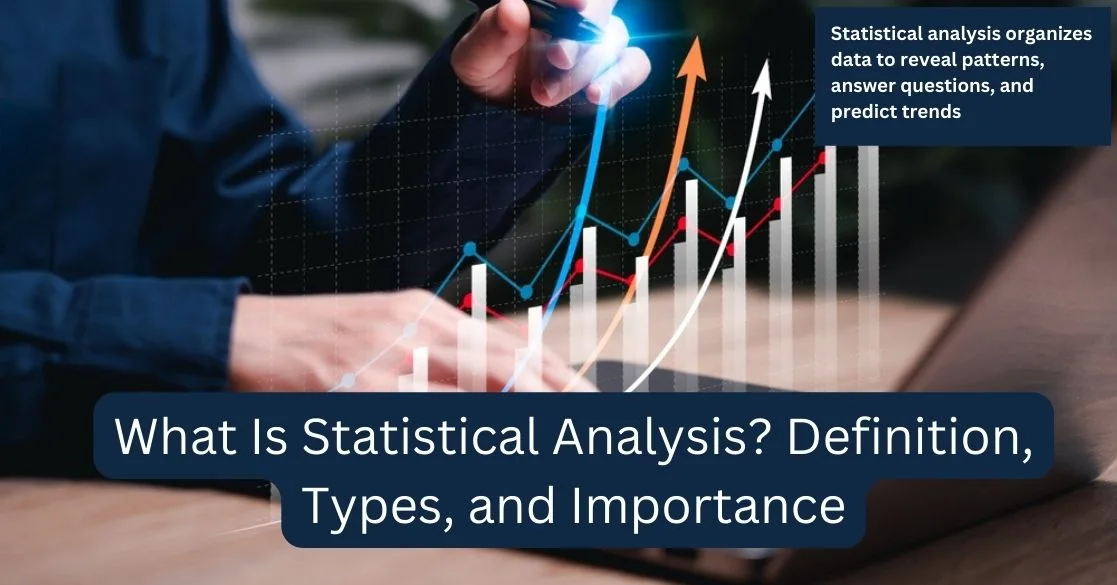
What Is Statistical Analysis?

Statistical analysis is the process of collecting, organizing, and studying data to spot patterns, answer questions, and make predictions. It helps us understand what’s happening, why it’s happening, and what might happen next.
From testing ideas in research to improving business operations, statistical analysis is used just about everywhere.
Companies rely on it for market research, scientists use it to prove or disprove theories, and healthcare teams depend on it to track how diseases spread and how treatments work.
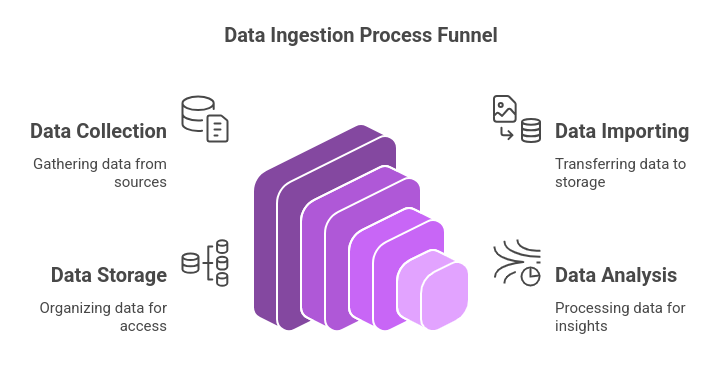
Also Read: What is Data Collection?
Types of Statistical Analysis
There’s no one-size-fits-all approach to statistical analysis. Depending on your data and goals, you might use one (or more) of these key types:
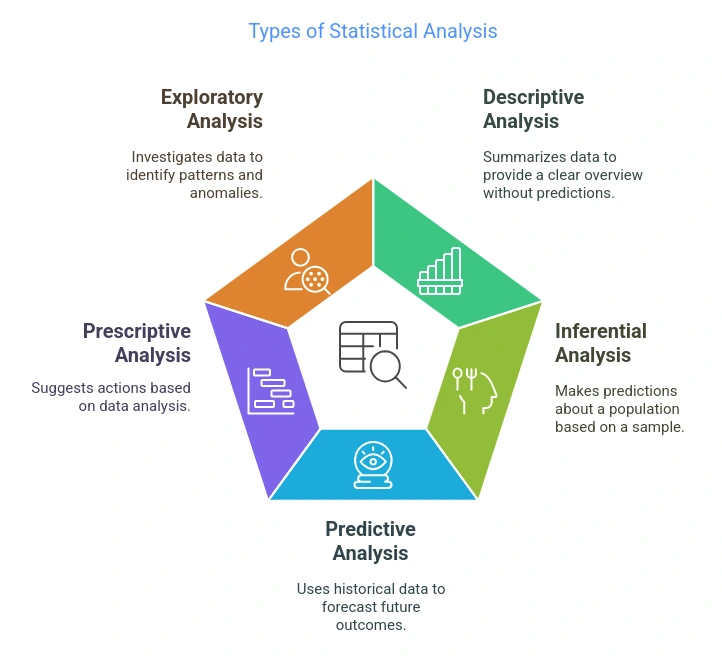
1. Descriptive Statistical Analysis
This is all about summarizing your data. Think of it as getting the “big picture.” You’re not making predictions—just describing what’s there.
Common techniques include:
- Averages and Medians: Finding the typical value.
- Ranges and Variability: Seeing how spread out the data is.
- Graphs and Charts: Visual tools like bar graphs, pie charts, and histograms make the data easier to understand.
Also Read: What is Descriptive Statistics?
2. Inferential Statistical Analysis
This type of analysis helps in making informed predictions about a larger population based on the observations from a smaller sample. It is comparable to tasting a small portion of soup to determine whether the entire pot requires additional seasoning.
Key methods include:
- Hypothesis Testing: Testing if your hypothesis about the data is true.
- Regression Analysis: Looking at how different factors affect each other.
- Confidence Intervals: Estimates where the true answer probably lies.
Also Read: What is Inferential Statistics?
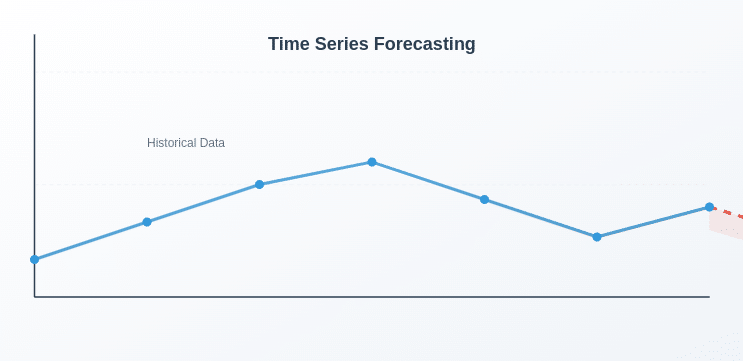
3. Predictive Statistical Analysis
Want to know what’s coming next? Predictive analysis uses past data to forecast future outcomes.
Popular techniques include:
- Predictive Models: In this, we use algorithms to guess future trends.
- Time Series Analysis: It’s applied to track how things change over time.
- Risk Assessments: Determining the likelihood of something going wrong.
4. Prescriptive Statistical Analysis
This takes things a step further by suggesting what actions to take next. It helps you decide the best path ahead based on different possibilities.
Useful methods include:
- Optimization Models: They are employed to discover the most effective solution.
- Simulations: Testing “what if” scenarios.
- Decision Trees: Mapping out choices and their outcomes.
5. Exploratory Data Analysis (EDA)
Exploratory Data Analysis (EDA) is akin to detective work. You probe the data pre-deep analysis to identify patterns, relationships, or anything out of the ordinary.
Typical tools include:
- Scatter Plots and Heat Maps: Visual clues about how things relate.
- Summary Statistics: Quick information about the overall shape of the data.
- Outlier Detection: Finding the oddballs that might throw things off.
6. Causal Analysis
This is where you determine if one thing causes another. It’s not just about spotting a link but understanding if A leads to B.
Common techniques include:
- Experiments and Trials: Comparing groups to see what works.
- Granger Causality Tests: Checking if one event helps predict another.
- Path Analysis: Mapping out direct and indirect relationships.
7. Mechanistic Analysis
This goes deep into how systems work. It breaks down the step-by-step processes to explain exactly how and why changes happen.
Key methods include:
- Mathematical Models: Creating formulas to describe what’s happening.
- System Simulations: Testing how different pieces interact.
- Process Mapping: Visualizing every process step to spot what’s driving the results.
Why Is Statistical Analysis Important?
Here’s why statistical analysis matters so much:
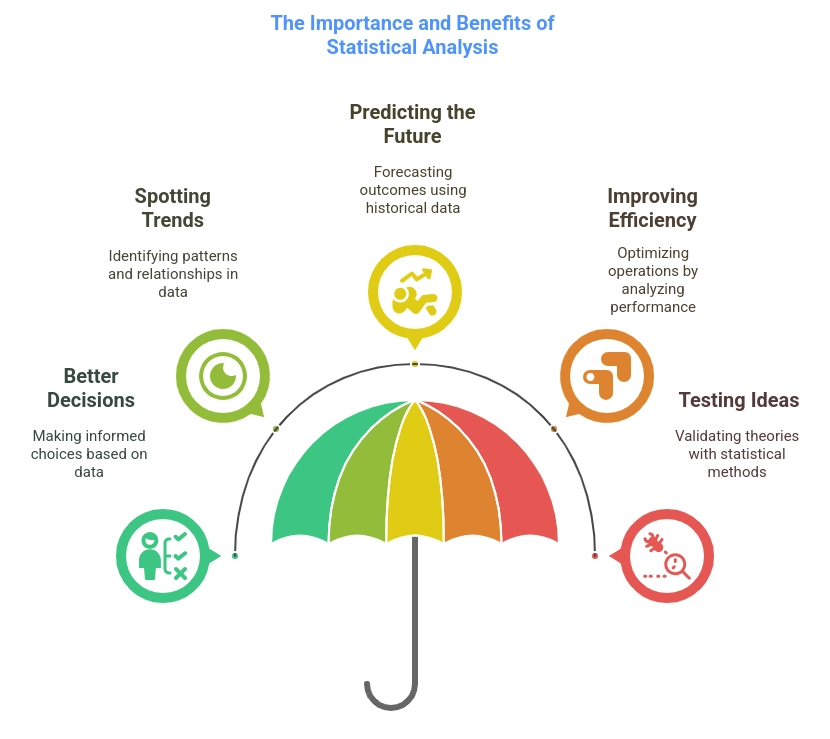
- Better Decisions: It helps businesses, researchers, and organizations base their choices on actual data, not just guesses.
- Spotting Trends: By analyzing data, you can identify patterns and relationships that would otherwise go unnoticed.
- Predicting the Future: Using past data to forecast future outcomes is key in fields like finance, healthcare, and marketing.
- Improving Efficiency: Businesses can fine-tune operations by analyzing what works and what doesn’t.
- Testing Ideas: Statistical methods help researchers prove or disprove theories with confidence.
Challenges in Statistical Analysis
Even though statistical analysis is helpful, it’s not always smooth sailing. Here are some common challenges:
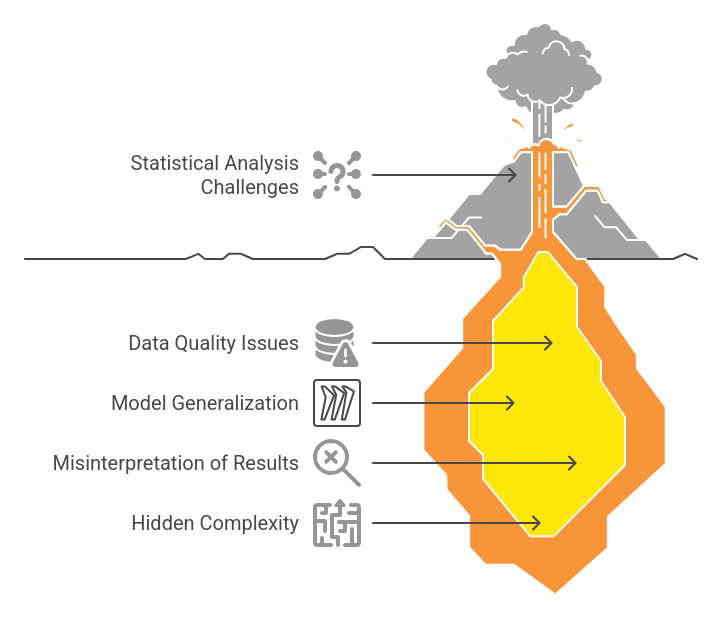
- Bad Data, Bad Results: If your data is messy, incomplete, or biased, the insights you get might be totally off.
- Overfitting Trouble: Sometimes, a model works perfectly on your sample data but falls apart when applied to real-world situations.
- Mixing Up the Meaning: Just because something is “statistically significant” doesn’t always mean it matters in real life. It’s easy to misread the numbers.
Final Thoughts
In a world overflowing with data, statistical analysis is what helps us make sense of it all. Whether running a business, conducting research, or working in healthcare, understanding how to analyze data can lead to smarter decisions, better predictions, and more substantial results.
Enhance your statistical analysis expertise with our comprehensive Data Science Program.
Master essential tools like Python, Machine Learning, and Generative AI through hands-on projects and live mentorship.
Earn dual certificates from McCombs School of Business at UT Austin and Great Lakes, and build a strong foundation for a successful data science career.
Frequently Asked Questions
1. What is the difference between descriptive and inferential statistics?
Descriptive statistics explain what your data shows, while inferential statistics help you make predictions about a more significant group based on a smaller sample.
Learn the detailed difference between Descriptive and Inferential Statistics and how they help summarize data and make predictions from datasets.
2. Why is statistical analysis important in business?
It helps businesses make smarter decisions, find trends, and work more efficiently by using data instead of guesswork.
3. What is hypothesis testing?
Hypothesis testing checks if your theory about the data holds up by analyzing a sample.
4. How does regression analysis work?
Regression analysis looks at how different factors affect each other and helps predict outcomes.
5. What is overfitting in statistical analysis?
Overfitting happens when a model is too focused on the sample data, making it unreliable when applied to new or different data.