Python is the top language for data science in 2025. It has simple syntax and a large, supportive community. This makes it a popular choice for both data analysts and machine learning engineers. But Python has over 137,000 libraries, and choosing the right one can be hard.
This guide will help you choose. It covers the essential libraries for any data science project. It also gives you a way to pick the right tool for a specific task. You'll learn which tools to use for manipulating data or building deep learning models. This guide is for new data scientists, developers changing fields, and students.
In this course, you will learn the fundamentals of Python: from basic syntax to mastering data structures, loops, and functions. You will also explore OOP concepts and objects to build robust programs.
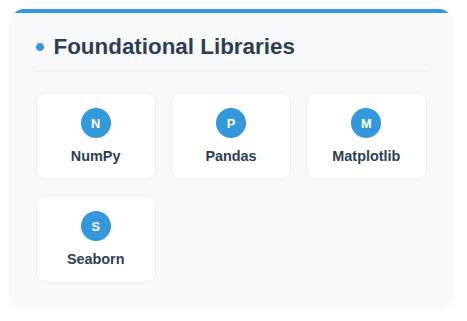
Foundational Libraries
Before you make complex machine learning models, you need to get, clean, and understand your data. These libraries are the tools you'll use every day.
1. NumPy (Numerical Python)
Core Function
NumPy is used for numerical computing in Python. It supports large, multi-dimensional arrays and matrices, and it has many high-level math functions for these arrays.
Why It's Essential
NumPy is fast. Its arrays use C, which makes them faster and more memory-efficient than standard Python lists. This speed comes from vectorization. Vectorization lets NumPy operate on whole arrays at once, which avoids slow Python loops.
Key Functions & Code Examples:
- np.array(): Makes a NumPy array.
- np.linspace(): Makes an array with evenly spaced numbers.
- np.dot(): Does matrix multiplication.
- np.linalg.inv(): Finds the inverse of a matrix.
import numpy as np

# Create a 2x3 array
my_array = np.array([[1, 2, 3], [4, 5, 6]])
print("NumPy Array:\n", my_array)

# Create an array of 5 numbers from 0 to 10
linear_space = np.linspace(0, 10, 5)
print("\nLinearly Spaced Array:", linear_space)

# Matrix multiplication
matrix_a = np.array([[1, 2], [3, 4]])
matrix_b = np.array([[5, 6], [7, 8]])
dot_product = np.dot(matrix_a, matrix_b)
print("\nDot Product:\n", dot_product)

# Matrix inverse
matrix_c = np.array([[1, 2], [3, 10]])
inverse_matrix = np.linalg.inv(matrix_c)
print("\nInverse Matrix:\n", inverse_matrix)
Pro-Tip:
Beginners confuse Python lists and NumPy arrays. They look similar but work differently. NumPy arrays must contain elements of the same type, and their size is fixed when you create them. This is why they are fast. Math operations on NumPy arrays apply to each element. But, the + operator joins two Python lists together.
2. Pandas (Data Manipulation and Analysis)
Core Function
Pandas is the main library for working with structured data. It uses two main data structures: the Series for one-dimensional data and the DataFrame for two-dimensional data.
Why It's Essential
Pandas makes data analysis simpler. It helps you read and write data from files like CSVs and SQL databases. You can also use it to clean data, handle missing values, and perform tasks like grouping and merging.
Key Functions & Code Examples:
- .head(): Shows the first few rows of a DataFrame.
- .describe(): Gives summary statistics for number columns.
- .groupby(): Puts data into groups based on columns to run calculations.
- .merge(): Joins different DataFrames using a shared column.
import pandas as pd

# Create a sample DataFrame
data = {'Product': ['A', 'B', 'A', 'B', 'A', 'C'],
        'Sales': [250, 180, 450, 210, 380, 90],
        'Region': ['North', 'North', 'South', 'South', 'North', 'South']}
df = pd.DataFrame(data)

print("First 5 Rows:\n", df.head())
print("\nSummary Statistics:\n", df.describe())

# Group by Product and calculate total sales
product_sales = df.groupby('Product')['Sales'].sum()
print("\nTotal Sales by Product:\n", product_sales)

# Create another DataFrame to merge
product_info = pd.DataFrame({
    'Product': ['A', 'B', 'C'],
    'Category': ['Electronics', 'Clothing', 'Home Goods']
})

# Merge the two DataFrames
merged_df = pd.merge(df, product_info, on='Product')
print("\nMerged DataFrame:\n", merged_df)
Pro-Tip:
Pandas is useful, but for datasets that don't fit in memory, you can use a library like Polars. Polars is built with Rust and uses parallel processing. This makes it faster on computers with multiple cores. If your Pandas code is slow, try Polars.
3. Matplotlib & Seaborn (Data Visualization)
Core Function
Matplotlib and Seaborn are the main libraries for making charts in Python. Matplotlib is the base library. It gives you a lot of control over your plots. Seaborn is built on Matplotlib. It helps you create nice-looking statistical charts with less code.
Why They're Essential
Data visualization is important. It helps you explore data and share what you find. Matplotlib can create many types of plots, including static, animated, and interactive ones. Seaborn makes it easier to create statistical plots like heatmaps and boxplots.
Key Plot Types & Code Examples:
- Line Plot (Matplotlib): plt.plot() - Shows trends over time.
- Bar Chart (Matplotlib): plt.bar() - Compares amounts between categories.
- Heatmap (Seaborn): sns.heatmap() - Visualizes data in a matrix, like correlations.
- Boxplot (Seaborn): sns.boxplot() - Shows the distribution of number data across categories.
import matplotlib.pyplot as plt
import seaborn as sns
import numpy as np
import pandas as pd

# Sample data
x = np.linspace(0, 10, 100)
y = np.sin(x)
categories = ['A', 'B', 'C']
values = [10, 15, 7]
correlation_matrix = np.corrcoef(np.random.rand(5, 5))
df_boxplot = pd.DataFrame({
    'Category': ['X', 'Y', 'X', 'Y', 'X', 'Y'],
    'Value': [12, 18, 11, 16, 15, 20]
})

# Matplotlib Line Plot
plt.figure(figsize=(12, 5))
plt.subplot(1, 2, 1)
plt.plot(x, y)
plt.title('Matplotlib Line Plot')
plt.xlabel('X-axis')
plt.ylabel('Y-axis')

# Matplotlib Bar Chart
plt.subplot(1, 2, 2)
plt.bar(categories, values)
plt.title('Matplotlib Bar Chart')
plt.xlabel('Category')
plt.ylabel('Value')
plt.tight_layout()
plt.show()

# Seaborn Heatmap
plt.figure(figsize=(12, 5))
plt.subplot(1, 2, 1)
sns.heatmap(correlation_matrix, annot=True, cmap='coolwarm')
plt.title('Seaborn Heatmap')

# Seaborn Boxplot
plt.subplot(1, 2, 2)
sns.boxplot(x='Category', y='Value', data=df_boxplot)
plt.title('Seaborn Boxplot')
plt.tight_layout()
plt.show()
Pro-Tip:
If you need interactive charts for a website, use Plotly. Here’s how it works. Plotly lets users zoom, pan, and hover on charts to see more detail. This is good for dashboards and web reports.
Master Data Science with Python Course
Learn Data Science with Python in this comprehensive course! From data wrangling to machine learning, gain the expertise to turn raw data into actionable insights with hands-on practice.
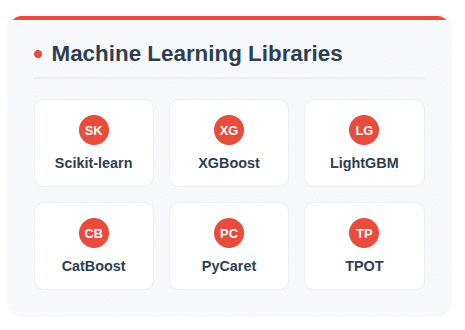
Machine Learning Libraries
After your data is clean, you can build models to make predictions. These libraries help you create both simple and automated models.
4. Scikit-learn (The ML Workhorse)
Core Function
Scikit-learn is the most used library for traditional machine learning.
Why It's Essential
It has a simple and consistent API. This makes it easy to use for tasks like classification, regression, and clustering. It also includes tools for model evaluation and feature scaling.
Key Functions & Code Examples:
A common process is to split data, scale it, and then train a model.
- train_test_split: Divides data into training and testing groups.
- StandardScaler: Changes features to have a mean of 0 and a variance of 1.
- LinearRegression: A model to predict a continuous number.
from sklearn.model_selection import train_test_split
from sklearn.preprocessing import StandardScaler
from sklearn.linear_model import LinearRegression
from sklearn.metrics import mean_squared_error
import numpy as np

# Sample Data
X = np.random.rand(100, 1) * 10
y = 2.5 * X + np.random.randn(100, 1) * 2

# 1. Split the data
X_train, X_test, y_train, y_test = train_test_split(X, y, test_size=0.2, random_state=42)

# 2. Scale the data
scaler = StandardScaler()
X_train_scaled = scaler.fit_transform(X_train)
X_test_scaled = scaler.transform(X_test)

# 3. Train the model
model = LinearRegression()
model.fit(X_train_scaled, y_train)

# 4. Make predictions and evaluate
y_pred = model.predict(X_test_scaled)
mse = mean_squared_error(y_test, y_pred)
print(f"Mean Squared Error: {mse:.2f}")
Pro-Tip:
Scikit-learn has an algorithm cheat-sheet. It’s a flowchart that helps beginners pick the right model.
5. Advanced Gradient Boosting Libraries (XGBoost, LightGBM, CatBoost)
Why They're Needed
For problems with structured data, like in Kaggle competitions, these libraries work better than Scikit-learn's standard models.
Brief Comparison:
- XGBoost: Known for its performance. It has features that help reduce overfitting.
- LightGBM: Faster than XGBoost and uses less memory. It’s a good choice for large datasets.
- CatBoost: Good at handling categorical features. This can save you preprocessing time.
Code Snippet (LightGBM):
Their APIs are similar to Scikit-learn's, which makes them easy to use.
import lightgbm as lgb
import numpy as np
from sklearn.model_selection import train_test_split
from sklearn.metrics import accuracy_score

# Sample classification data
X, y = np.random.rand(100, 5), np.random.randint(0, 2, 100)
X_train, X_test, y_train, y_test = train_test_split(X, y, test_size=0.2, random_state=42)

# Train a LightGBM classifier
lgb_clf = lgb.LGBMClassifier()
lgb_clf.fit(X_train, y_train)

# Predict and evaluate
y_pred = lgb_clf.predict(X_test)
print(f"LightGBM Accuracy: {accuracy_score(y_test, y_pred):.2f}")
5. Automated Machine Learning (AutoML) Libraries (PyCaret, TPOT)
What is AutoML?
AutoML automates machine learning tasks. These tasks include model selection and hyperparameter tuning.
Why Use Them
AutoML libraries help you experiment faster. For example, PyCaret can prepare data and train many models with just a few lines of code. TPOT uses genetic programming to find the best model.
Code Snippet (PyCaret):
This code shows how easy it is to find the best classification model.
# Note: This code is for demonstration and requires the PyCaret library to be installed.
# from pycaret.classification import setup, compare_models
# from sklearn.datasets import make_classification
# import pandas as pd

# X, y = make_classification(n_samples=1000, n_features=10, n_informative=5, n_redundant=5, random_state=1)
# data = pd.DataFrame(X, columns=[f'feature_{i}' for i in range(10)])
# data['target'] = y

# # Set up the environment and run model comparison
# clf1 = setup(data=data, target='target', session_id=123)
# best_model = compare_models()
# print(best_model)
Learn Machine Learning with Python
Learn machine learning with Python! Master the basics, build models, and unlock the power of data to solve real-world challenges.
Deep Learning & NLP Libraries
Deep learning libraries are needed for working with data like images and text.
6. TensorFlow & PyTorch (The Deep Learning Giants)
Core Function
TensorFlow and PyTorch are the two main frameworks for deep learning.
Key Differences
Researchers prefer PyTorch because it's flexible and feels more like Python. TensorFlow is used in production because it scales well and has good deployment tools. But the differences are smaller.
Keras
Keras is the official high-level API for TensorFlow. It provides an easier way to build models. Most people using TensorFlow should start with Keras.
7. Hugging Face Transformers (The NLP Library)
What it is
Hugging Face Transformers gives you access to thousands of pre-trained models for NLP tasks.
Why it's helpful
Using these pre-trained models saves a lot of time and computing power. Here's how it works. You don't have to train a model from the beginning. You can take an existing model and fine-tune it for your specific task. This makes advanced NLP available to more people.
Specialized & Scalable Computing Libraries
Sometimes you need a special tool for a specific job or for very large datasets.
8. Statsmodels (Statistical Analysis)
Core Function
Statsmodels is a library for detailed statistical testing and analysis.
When to Use It
Use Statsmodels when you care more about understanding relationships than just making predictions. For example, if you need p-values and confidence intervals, use Statsmodels.
9. Dask (Parallel Computing)
Core Function
Dask is a library for parallel computing. It lets you use NumPy and Pandas on datasets that are too big for memory.
When to Use It
You should use Dask when your dataset doesn't fit in RAM. Here's how it works. Dask splits large arrays or DataFrames into smaller parts. Then, it processes these parts in parallel. This helps you work with large datasets using familiar code.
How to Choose the Right Library
How do you pick the right library? Here are some steps to follow.
Project Requirements
First, define your project's goal. Are you exploring data, building a dashboard, or deploying a model? Your goal determines which tool you should choose.
Performance and Scalability
Second, think about your data size. Pandas is fine for smaller data. For data that won't fit in memory, use Dask or Polars.
Community and Documentation
Third, check the community and documentation. A good library has recent updates on GitHub and many tutorials. This support will help you when you get stuck.
How it Works with Other Tools
Fourth, see how well the library works with other tools. For example, NumPy, Pandas, and Scikit-learn all work well together. Make sure a new library fits with the tools you already use.
Summary Table
| Library | Primary Use Case | Best for... |
|---|---|---|
| NumPy | Numerical & Scientific Computing | Fast mathematical operations on arrays and matrices. |
| Pandas | Data Manipulation & Analysis | Cleaning, transforming, and analyzing structured data. |
| Matplotlib | Foundational Data Visualization | Creating a wide range of highly customizable plots. |
| Seaborn | Statistical Data Visualization | Quickly creating beautiful and informative statistical plots. |
| Scikit-learn | Traditional Machine Learning | Implementing and evaluating a wide range of ML algorithms. |
| XGBoost/LightGBM | Advanced Gradient Boosting | Achieving high performance on structured data. |
| PyCaret/TPOT | Automated Machine Learning (AutoML) | Rapidly experimenting with and comparing multiple models. |
| TensorFlow/PyTorch | Deep Learning | Building and training complex neural networks. |
| Hugging Face | Natural Language Processing (NLP) | Accessing and fine-tuning pre-trained language models. |
| Statsmodels | Statistical Inference & Modeling | In-depth statistical analysis and hypothesis testing. |
| Dask | Scalable & Parallel Computing | Processing datasets that are too large to fit in memory. |
| Plotly | Interactive Visualizations | Creating web-based, interactive charts and dashboards. |
Frequently Asked Questions
1. How do I manage all these libraries for different projects?
You should use a virtual environment. A virtual environment is a private space for each project. This lets you install specific versions of libraries for one project without affecting others.
- For example, Project A might need an older version of Scikit-learn, while Project B needs the newest one.
- Here’s how it works: You can use tools like venv, which comes with Python, or conda, which is popular in data science. Do this: create a new environment, activate it, and then install the libraries you need for that specific project.
2. As a beginner, what's a good order to learn these libraries?
Start with the foundational tools first. A good learning path is:
- NumPy: Learn how to work with its arrays. This is the base for almost everything else.
- Pandas: Once you understand NumPy, move to Pandas to learn how to clean and organize data in DataFrames.
- Matplotlib & Seaborn: Next, learn to visualize the data you've organized. This helps you find patterns.
- Scikit-learn: After you can manage and see data, you are ready to start building machine learning models.
3. The article mentions Dask. How does it compare to other big data tools like Apache Spark?
Dask and Spark both help you process large datasets. They just do it in different ways.
- Dask is great if you already know Pandas and NumPy. It uses their existing code styles to work on data that is too big for memory. This makes it easy for Python users to learn.
- Apache Spark is a complete system for big data processing. It has its own way of doing things and is not just for Python. It is used in large companies for big, complex data pipelines.
Choose Dask if you want to scale your current Python code. Choose Spark for a more complete, but more complex, big data solution.
4. What about building interactive dashboards? What libraries are good for that?
The article mentions Plotly for interactive charts. If you want to build a full dashboard or web app from your Python code, you can use libraries like Streamlit or Dash.
- Streamlit is known for being simple. You can turn a data script into a shareable web app with just a few commands. It's good for quickly creating prototypes.
- Dash is built by the same people who made Plotly. It gives you more control over the look and feel of your app. It is better for building more complex, production-ready dashboards.
5. Do I need to install all these libraries myself? What about tools like Google Colab?
No, you don't always need to install them. Cloud-based tools like Google Colab and Kaggle Notebooks are very popular. They are coding environments that run in your web browser. They come with almost all of these data science libraries pre-installed and ready to use. This saves you setup time. It's a great way to start learning and experimenting without worrying about installation.
