Data has now become the pillar of decision-making across all industries. But before using its power, you need to know if you require data analysis or data analytics.
Though both are about working with data, their methods and purposes are very different. One is about finding trends in the past, and the other is about forecasting what's next.
Knowing their differences can assist businesses in optimizing their strategies and help professionals decide on the correct career path. Let's proceed to the main differences.
Statistics Course for Data Science and Analytics
Learn statistical methods crucial for data science, including regression and hypothesis testing, to extract valuable insights from data.
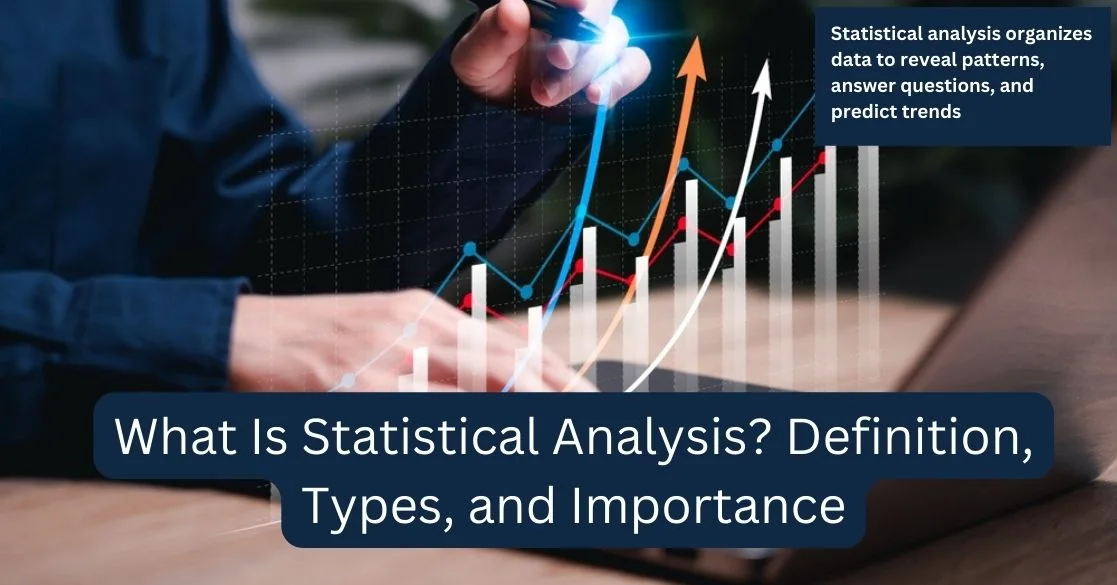
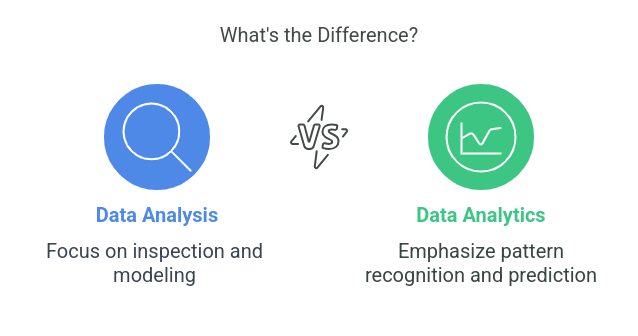
What is Data Analysis?
Data analysis is the process of inspecting, cleaning, transforming, and modeling data to discover useful insights, draw conclusions, and support decision-making.
It focuses on understanding past data to identify patterns, relationships, and trends. The primary goal of data analysis is to extract meaningful information from raw data and present it in a way that is easy to interpret.
Standard Techniques Used in Data Analysis
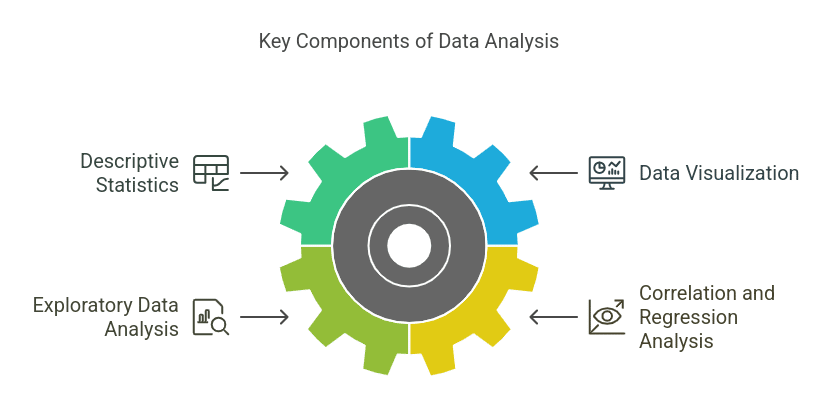
- Descriptive Statistics – Summarizing data using mean, median, mode, standard deviation, & variance.
- Data Visualization – Representing data graphically through charts, graphs, and dashboards to identify patterns.
- Exploratory Data Analysis (EDA) – Investigating data distributions, missing values, & outliers to uncover hidden trends.
- Correlation and Regression Analysis – Determining relationships between variables and predicting outcomes based on historical data.
To check the learning better, take Data Analysis Quiz.
Example of Data Analysis:
A retail company analyzes past sales data to identify peak shopping seasons and customer preferences. By understanding which products sell best during specific months, the company can adjust inventory levels and marketing strategies to maximize sales.
What is Data Analytics?
Data analytics is a broader concept that encompasses various methods to extract insights, predict trends, & drive strategic decisions.
It extends beyond just analyzing past data & involves using advanced algorithms, statistical models, & machine learning to derive meaningful business intelligence.
Unlike traditional data analysis, data analytics aims to answer not just what happened, but also why it happened, what will happen next, and how to improve outcomes.
Different Types of Data Analytics
- Descriptive Analytics – Summarizes historical data to identify trends and patterns (e.g., monthly sales reports).
- Diagnostic Analytics – Explains why something happened by analyzing correlations and root causes (e.g., customer churn analysis).
- Predictive Analytics – Uses statistical models and machine learning to forecast future trends (e.g., predicting stock prices).
- Prescriptive Analytics – Suggests actionable strategies based on predictive insights (e.g., recommending personalized offers to customers).
Example of Data Analytics:
A health care organization utilizes predictive analytics to predict disease epidemics by cross-examining patient histories, external conditions, and historical patterns. This helps prepare resources in advance, maximize medical staff utilization, and enhance patient health.
Comparison of Data Analysis and Data Analytics
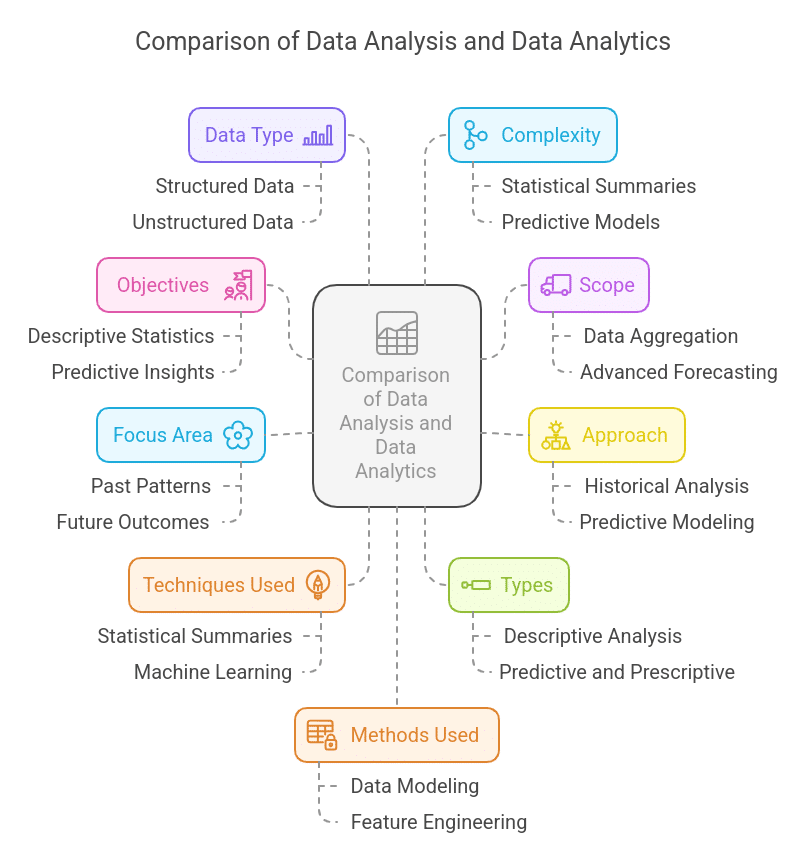
Objective
- Data Analysis: It uses descriptive statistics, data visualization, correlation analysis, exploratory data analysis (EDA), hypothesis testing, and data cleaning.
- Data Analytics: It goes beyond past data to provide predictive and prescriptive insights for decision-making.
Scope
- Data Analysis: It aggregates, classifies, sorts, and applies basic statistics and visualization techniques.
- Data Analytics: It encompasses data analysis along with advanced forecasting and optimization.
Approach
- Data Analysis: It answers “What happened?” by analyzing past data.
- Data Analytics: It answers “Why did it happen?”, “What will happen next?”, and “How can we improve it?” using advanced analytics.
Focus Area
- Data Analysis: It identifies and summarizes past patterns and trends.
- Data Analytics: It uses predictive models to anticipate future outcomes and recommend actions.
Techniques Used
- Data Analysis: It applies predictive modeling, machine learning, artificial intelligence, prescriptive analytics, data mining, deep learning, and optimization techniques.
- Data Analytics: It primarily summarizes and interprets data.
Types
- Data Analysis: It includes descriptive and diagnostic analysis.
- Data Analytics: It covers descriptive, diagnostic, predictive, and prescriptive analytics.
Data Type
- Data Analysis: It uses structured data from databases, spreadsheets, and reports.
- Data Analytics: It uses structured, semi-structured, and unstructured data from multiple sources like social media, IoT devices, images, videos, and big data platforms.
Complexity
- Data Analysis: It remains less complex as it primarily involves statistical summaries and reports.
- Data Analytics: It becomes more complex due to predictive modeling, deep learning, and decision automation.
Methods Used
- Data Analysis: It employs data modeling, feature engineering, algorithmic predictions, and decision-making frameworks.
- Data Analytics: It applies these methods in industries such as finance, healthcare, and retail for reporting, performance tracking, and trend analysis.
Use Cases
- Data Analysis: It uses standard tools like Microsoft Excel, SQL, Google Sheets, and visualization software such as Tableau and Power BI.
- Data Analytics: It applies techniques in business intelligence, fraud detection, risk assessment, marketing analytics, and strategic decision-making.
Key Outputs
- Data Analysis: It produces dashboards, reports, summary statistics, and identifies historical trends.
- Data Analytics: It produces predictive models, AI-driven insights, optimization strategies, and automated decision-making frameworks.
Tools Used
- Data Analysis: It relies on common tools like Microsoft Excel, SQL, Google Sheets, and basic visualization software.
- Data Analytics: It utilizes advanced tools such as Python, R, TensorFlow, SAS, Hadoop, Spark, AWS, Azure, and Google Cloud.
Career Roles
- Data Analysis: It prepares professionals for roles such as Data Analyst, Business Analyst, Research Analyst, and Marketing Analyst.
- Data Analytics: It paves the way for careers like Data Scientist, Data Engineer, Machine Learning Engineer, AI Engineer, and Big Data Engineer.
Decision-Making Impact
- Data Analysis: It helps businesses understand past events and make informed decisions based on historical data.
- Data Analytics: It guides businesses to take proactive actions using predictive and prescriptive insights.
Dependencies
- Data Analysis: It relies on existing datasets, reports, and descriptive insights.
- Data Analytics: It requires advanced statistical modeling, AI-driven algorithms, and automated systems.
Learning Curve
- Data Analysis: It is easier to learn with a focus on statistics, visualization, and business intelligence tools.
- Data Analytics: It demands knowledge of coding, machine learning, deep learning, and cloud-based big data technologies.
How do Data Analysis and Data Analytics Work Together?
Data Analysis and Data Analytics are interconnected, where the former lays the groundwork for the latter.
Here’s how they complement each other:
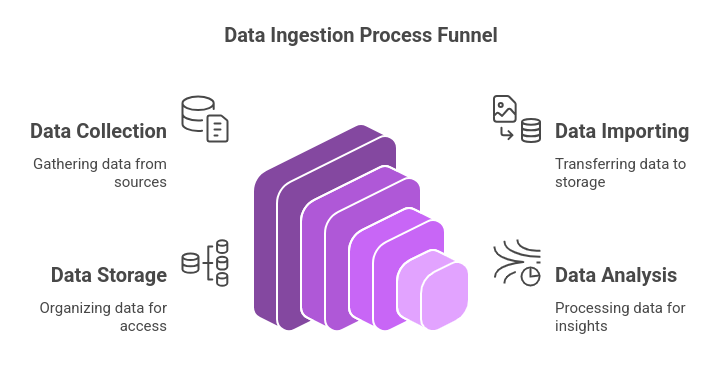
- Data Cleaning & Preprocessing: Before applying advanced analytics, raw data needs to be cleaned, structured, & explored. Data analysis ensures accuracy and consistency in data.
- Understanding Historical Trends: Data analysis identifies past trends & patterns, which are then used by data analytics models to make future predictions.
- Feature Selection for Machine Learning: Data analysis helps in selecting relevant features by examining relationships between variables, making analytics models more efficient.
- Descriptive Insights for Decision-Making: Businesses use data analysis for quick reporting, while analytics extends it by generating predictive and prescriptive recommendations.
Examples Where Data Analysis and Data Analytics Work Together
1. Healthcare – Predicting Disease Outbreaks
- Data Analysis: Hospitals analyze historical patient data, identifying trends in disease prevalence based on geography, seasonality, and demographics.
- Data Analytics: Predictive models use this analyzed data to anticipate future outbreaks, allowing governments to allocate resources in advance.
- Example: The COVID-19 pandemic saw governments analyzing past infection trends while using predictive analytics to forecast future surges.
2. E-commerce – Personalized Customer Experience
- Data Analysis: Retailers examine customer purchase history, browsing behavior, and product preferences to group customers into segments.
- Data Analytics: AI-driven recommendation engines use this data to suggest personalized products, optimize pricing, and improve customer experience.
- Example: Amazon’s recommendation system analyzes past purchases (data analysis) and predicts what customers might want to buy next (data analytics).
3. Banking & Fraud Detection
- Data Analysis: Banks study historical transaction records to identify unusual spending patterns.
- Data Analytics: Machine learning algorithms detect fraudulent transactions in real-time by flagging suspicious activity.
- Example: If a credit card is suddenly used in multiple high-value transactions within minutes, predictive analytics can trigger a security alert.
4. Sports Analytics – Player Performance Optimization
- Data Analysis: Teams track player statistics, injury history, and fitness levels.
- Data Analytics: AI models analyze this data to predict potential injuries, suggest personalized training regimens, and optimize game strategy.
- Example: In the NBA, teams use past player performance data to determine optimal lineups and predict game outcomes.
5. Marketing & Customer Retention
- Data Analysis: Companies assess churn rates and identify common reasons why customers stop engaging with their brand.
- Data Analytics: AI-driven models predict which customers are most likely to churn and recommend personalized retention strategies.
- Example: Streaming services like Netflix analyze viewing history (data analysis) and recommend content to improve user engagement (data analytics).
Conclusion
Data analysis is useful for interpreting historical trends, but data analytics opens the door to predictive insights that can propel future success.
Both data analysis and data analytics need to be mastered by anyone who wants to use data for strategic decision-making. Whether you want to develop skills in statistical analysis, machine learning, or business intelligence, acquiring the appropriate skills can make you stand out in the field.
If you wish to boost your career in this sector, Great Learning's Data Science and Analytics course gives you hands-on experience with tools such as Python, R, SQL, and Tableau, arming you with the skills to succeed in the data field.
You can also opt for Free Data Analytics Courses.