


Did you know that properly preparing your data can improve your model’s performance?
Techniques like normalization and standardization help scale data correctly, leading to better results and easier interpretation.
Want to know the difference between these two techniques? Keep reading we’ll explain it in a simple way! But first, let’s quickly understand why data preprocessing is important in machine learning.
Data preprocessing in Machine Learning
In Machine Learning, you can describe Data preprocessing as the process of preparing raw data for ML algorithms. It requires data preprocessing steps such as Data cleaning (Fixing incorrect or incomplete data), Data reduction (Removing redundant or irrelevant data), and Data transformation (Converting data to a preferred format).
This process is a crucial part of ML because it directly influences the performance and precision of the models. One of the common data preprocessing steps in machine learning is Data scaling, which is the process of modifying the range of data values without changing the data itself.
Scaling data is important before using it for ML algorithms because it ensures features have a comparable range, preventing those with larger values from dominating the learning process.
By using this approach, you can improve model performance and get faster convergence and better interpretability. ML can detect any vulnerabilities or weaknesses in encryption methods, ensuring they Keep data secure.
Definitions and Concepts
Data Normalization
In machine learning, data normalization transforms data features to a consistent range( 0 to 1) or a standard normal distribution to prevent features with larger scales from dominating the learning process.
It is also known as feature scaling, and its primary goal is to make the features comparable. It also improves the performance of ML models, especially those sensitive to feature scaling.
Normalization techniques are used to rescale data values into a similar range, which you can achieve using methods like min-max scaling (rescaling to a 0-1 range) or standardization (transforming to a zero-mean, unit-variance distribution). In ML, data normalization, min-max scaling transforms features to a specified range using the formula given below-
Formula: X_normalized = (X – X_min) / (X_max – X_min).
Where:
X is the original feature value.
X_min is the min value of the feature in the dataset.
X_max is the max value of the feature in the dataset.
X_normalized is the normalized or scaled value.

For example, imagine you have a dataset with two features: “Room” (ranging from 1 to 6) and “Age” (ranging from 1 to 40). Without normalization, the “Age” feature would likely dominate the “Room” feature in calculations, as its values are larger. Let’s take a random value from the above data set to see how normalization works- Room= 2, Age= 30
Before Normalization:
As you can see, the scatter plot shows “Age” values spread much more expansively than “Room” values before normalization, making it difficult to find any patterns between them.

After Normalization:
Using the normalization formula X_normalized = (X – X_min) / (X_max – X_min), we get-
Room2_normalized = (2-1)/(6-1 )= 3/5 = 0.6
Age30_normalized = (30-1)/(40-1) = 29/39 = 0.74
0.6 and 0.74 are new normalized values that fall within the range of 0-1. If perform normalized on all the feature values and plotted them we will get a distribution just like the below-

Now, this scatter plot shows “Room” and “Age” values scaled to the 0 to 1 range. This allows you to find a much clearer comparison of their relationships.
Data Standardization
Data standardization is known as Z-score normalization. It is another data preprocessing technique in ML that scales features to have a mean of 0 and a standard deviation of 1. This technique ensures all features are on a comparable scale.
This technique helps ML algorithms, especially those sensitive to feature scaling like k-NN, SVM, and linear regression, to perform better. Furthermore, it prevents features with larger scales from dominating the model’s output and makes the data more Gaussian-like, which is beneficial for some algorithms.
Standardization transforms the data by subtracting the mean of each feature and dividing it by its standard deviation. Its formula is given below-
Formula: X’ = (X – Mean(X)) / Std(X)
Where:
X is the original feature value.
X’ is the standardized feature value.
Mean(X) is the mean of the feature.
Std(X) is the standard deviation of X.
For example, here is a dataset with large feature values: “Salary” (ranging from 0 to 140000) and “Age” (ranging from 0 to 60). Here, you can see that without standardization, the “Salary” feature would likely dominate the “Age” feature in calculations due to larger feature values.
To understand it clearly, let’s assume a random value from the above data set to see how standardization works-
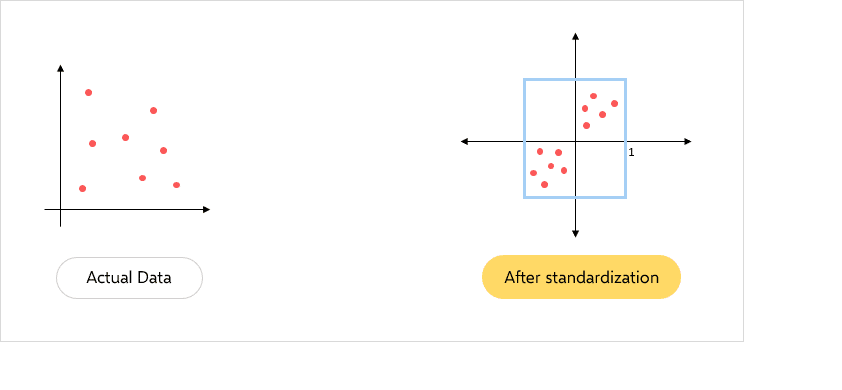
Before standardization
Let’s say a feature has values:
Salary= 100000, 115000, 123000, 133000, 140000
Age= 20, 23, 30, 38, 55
After standardization
Using formula X' = (X - Mean(X)) / Std(X)
Salary= 100000, 115000, 123000, 133000, 140000
Mean(X) = 122200
Standard Deviation Std(X) = 15642.89 (approximately)
Standardized values:
Salary X'= (100000 - 122200) / 15642.89 = -1.41
(115000 - 122200) / 15642.89 = -0.46
(123000 - 122200) / 15642.89 = 0.05
(133000 - 122200) / 15642.89 = 0.69
(140000 - 122200) / 15642.89 = 1.13
Similarly
Age X'=-0.94, -0.73, -0.22, 0.34, 1.55

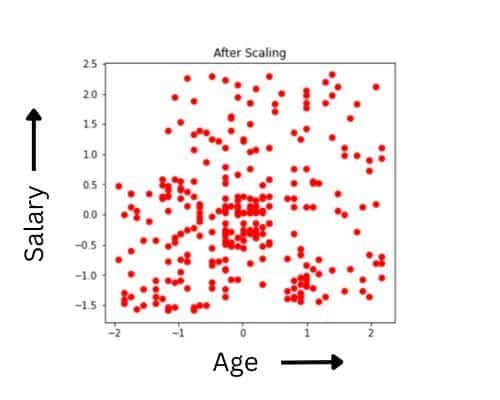
Before and after the normalization, both the plots will be the same. The only difference is in the X and Y scales. After normalization, the mean has shifted towards the origin.
Key Differences
| Parameter | Normalization | Standardization |
| Definition | Transforms data features to a consistent range 0 to 1 | Scales feature to have a mean of 0 and a standard deviation of 1 |
| Purpose | To change the scale of the features so that they fit within a specific range for easy feature comparison. | To change the distribution of the features to a standard normal distribution to prevent features with larger scales from dominating the model’s output. |
| Formula | X_normalized = (X – X_min) / (X_max – X_min) | (X – Mean(X)) / Std(X) |
| Dependency on Distribution | Does not have a dependency on the distribution of the data. | Assumes the distribution of data is normal. |
| Sensitivity to Outliers | Less sensitive to outliers as it requires precise techniques to adjust for outliers. | Highly sensitive to outliers as min and max are influenced by extreme values, providing a consistent approach to fixing outlier problems. |
| Impact on the Shape of Plot | If there are significant outliers, the plot can be changed. | Maintains the original shape of the plot but aligns it to a standard scale. |
| Use Cases | Useful for ML algorithms, particularly those sensitive to feature scales, e.g., neural networks, SVM, and k-NN. | Useful for ML algorithms that assume data is normally distributed or features have vastly different scales, e.g., Cluster models, linear regression, and logistic regression. |
Data Normalization vs. Standardization: Scale and Distribution
1. Effect on Data Range:
- Normalization: As we saw earlier, Normalization directly modifies the range of the data to ensure all values fall within the defined boundaries. It is preferable when you are uncertain about the exact feature distribution or the data distribution does not match the Gaussian distribution. Thus, this technique offers a reliable approach to help the model perform better and more accurately.
- Standardization: On the other hand, it does not have a predefined range, and the transformed data can have values outside of the original range. Thus, this method is very effective if the feature distribution of the data is known or the data distribution matches the Gaussian distribution.
2. Effect on Distribution:
- Normalization: Normalization doesn’t inherently change the shape of the distribution; it primarily focuses on scaling the data within a specific range.
- Standardization: On the contrary, Standardization mainly focuses on the distribution, centering the data around a mean of 0 and scaling it to a standard deviation of 1.
Use cases: Data Normalization vs. Standardization
Scenarios and models that benefit from normalization:

Normalization benefits several ML models, particularly those sensitive to feature scales. For instance-
- Models such as PCA, neural networks, and linear models like linear/logistic regression, SVM, and k-NN greatly benefit from normalization.
- In Neural Networks, normalization is a standard practice as it can lead to faster convergence and better generalization performance.
- Normalization also decreases various effects due to scale differences of input features as it makes the inputs more congruous. This way, normalizing input for an ML model improves convergence and training stability.
Scenarios and models that benefit from standardization:

Various ML models as well as those dealing with data where features have vastly different scales, benefit significantly from data standardization. Here are some examples:
- Support Vector Machine (SVM) often requires Standardization as it maximizes the span between the support vectors and the separating plane. Thus, Standardization is needed when computing the span distance to ensure one feature won’t dominate another feature if it assumes a large value.
- Clustering models contain algorithms that work based on distance metrics. That means features with larger values will exert a more significant effect on the clustering outcome. Thus, it is essential to standardize the data before developing a clustering model.
- If you have a Gaussian data distribution, standardization is more effective than other techniques. It works best with a normal distribution and benefits ML algorithms assuming a Gaussian distribution.
Advantages and Limitations
Advantages of Normalization
Normalization has various advantages that make this technique widely popular. Some of them are listed below-

- High Model Accuracy: Normalization helps algorithms make more accurate predictions by preventing features with larger scales from dominating the learning process.
- Faster Training: It can speed up the training process of models and help them converge more quickly.
- Better Handling of Outliers: It can also reduce the impact of outliers and prevent them from having an undue influence on the model.
Limitations of Normalization
Normalization surely has its advantages but it also carries some drawbacks that can affect your model performance.
- Loss of Information: Normalization can sometimes lead to a loss of information, mostly in cases where the original range or distribution of the data is meaningful or crucial for the analysis. For example, if you normalize a feature with a large range, the original scale might be lost, potentially making it harder to interpret the feature’s contribution.
- Increased Computational Complexity: It adds an extra step to the data preprocessing pipeline, which can increase computational time, especially for large datasets or real-time applications.
Advantages of Standardization
Standardization also has its edge over other techniques in various scenarios.

- Improved Model Performance: Standardization ensures features are on the same scale, thus allowing algorithms to learn more effectively, ultimately improving the performance of ML models.
- Easier Comparison of Coefficients: It allows you a direct comparison of model coefficients, as they are no longer influenced by different scales.
- Outlier Handling: It can also help mitigate the impact of outliers, as they are less likely to dominate the model’s output.
Limitations of Standardization
Standardization, while beneficial for many machine learning tasks, also has drawbacks. Some of its major drawbacks are listed below-
- Loss of Original Unit Interpretation: Standardizing data transforms values into a standardized scale (mean of 0, standard deviation of 1), which can make it difficult to interpret the data in its original context.
- Dependency on Normality Assumption: It assumes that the data follows a normal distribution. If the data is not normally distributed, applying standardization might not be appropriate for your model and could lead to misleading results.
Conclusion
Feature scaling is an essential part of data preprocessing in ML. A thorough understanding of the suitable technique for each dataset can substantially enhance the performance and accuracy of models.
For example, normalization proves to be particularly effective for distance-based and gradient-based algorithms. On the other hand, you should use standardization for algorithms that include weights and those that assume a normal distribution. In a sense, you should select the most suitable technique for the specific scenario at hand, as both approaches can yield significant benefits when applied appropriately.


