Confusion Matrix – An Overview with Python and R

CONFUSION MATRIX

Introduction

To develop a machine learning classification model, we first collect data, then perform data exploration, data pre-processing, and cleaning. After completing all these processes, we apply the classification technique to achieve predictions from that model. This is a brief idea about how we develop a machine learning model. Before finalising the classifier model, we have to be sure if it is performing well or not. Confusion Matrix measures the performance of a classifier to check efficiency and precision in predicting results. In this article, we will study the confusion matrix in detail.

Confusion Matrix Definition

A confusion matrix is used to judge the performance of a classifier on the test dataset for which we already know the actual values. Confusion matrix is also termed as Error matrix. It consists of a count of correct and incorrect values broken down by each class. It not only tells us the error made by classifier but also tells us what type of error the classifier made. So, we can say that a confusion matrix is a performance measurement technique of a classifier model where output can be two classes or more. It is a table with four different groups of true and predicted values.

Terminologies in Confusion Matrix

The confusion matrix shows us how our classifier gets confused while predicting. In a confusion matrix we have four important terms which are:

  1. True Positive (TP)
  2. True Negative (TN)
  3. False Positive (FP)
  4. False Negative (FN)

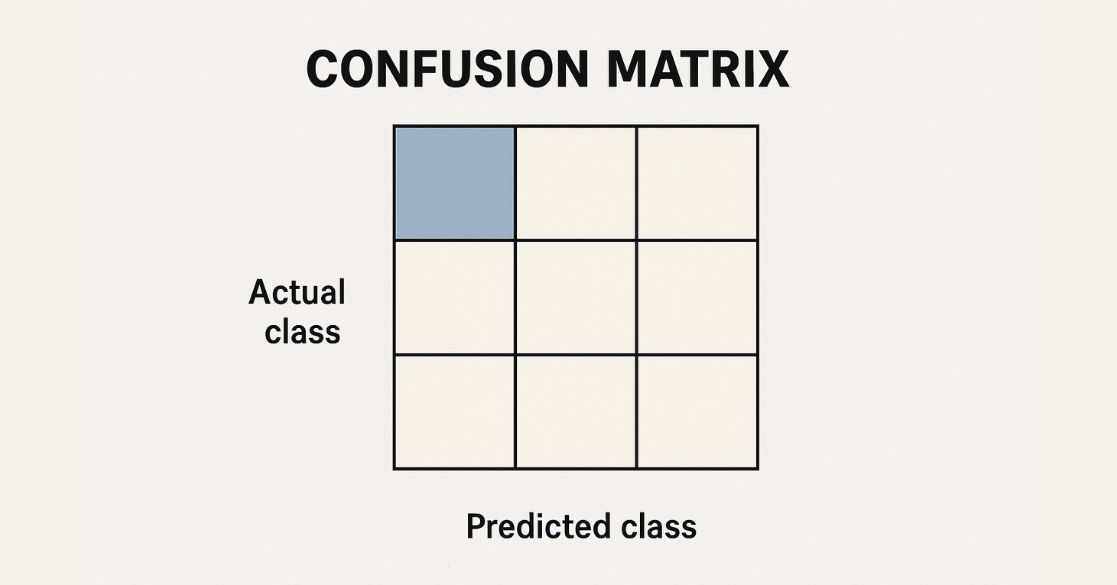
We will explain these terms with the help of visualisation of the confusion matrix:

This is what a confusion matrix looks like. This is a case of a 2-class confusion matrix. On one side of the table, there are predicted values and on one side there are the actual values. 

Let’s discuss the above terms in detail:

True Positive (TP)

Both actual and predicted values are Positive.

True Negative (TN)

Both actual and predicted values are Negative.

False Positive (FP)

The actual value is negative but we predicted it as positive. 

False Negative (FN)

The actual value is positive but we predicted it as negative.

Performance Metrics 

Confusion matrix not only used for finding the errors in prediction but is also useful to find some important performance metrics like Accuracy, Recall, Precision, F-measure. We will discuss these terms one by one.

Accuracy

As the name suggests, the value of this metric suggests the accuracy of our classifier in predicting results.

It is defined as:

Accuracy = (TP + TN) / (TP + TN + FP + FN)

A 99% accuracy can be good, average, poor or dreadful depending upon the problem.

Precision

Precision is the measure of all actual positives out of all predicted positive values. 

It is defined as:

Precision = TP / (TP + FP)

Recall

Recall is the measure of positive values that are predicted correctly out of all actual positive values.

It is defined as:

Recall = TP / (TP + FN)

High Value of Recall specifies that the class is correctly known (because of a small number of False Negative).

F-measure

It is hard to compare classification models which have low precision and high recall or vice versa. So, for comparing the two classifier models we use F-measure. F-score helps to find the metrics of Recall and Precision in the same interval. Harmonic Mean is used instead of Arithmetic Mean. 

F-measure is defined as:

F-measure = 2 * Recall * Precision / (Recall + Precision)

The F-Measure is always closer to the Precision or Recall, whichever has a smaller value.

Calculation of 2-class confusion matrix

Let us derive a confusion matrix and interpret the result using simple mathematics.

Let us consider the actual and predicted values of y as given below:

Actual yY predictedPredicted y with threshold 0.5
10.71
00.10
00.61
10.40
00.20

Now, if we make a confusion matrix from this, it would look like:

N=5Predicted 1Predicted 0
Actual: 11 (TP)1 (FN)
Actual: 01 (FP)2 (TN)

This is our derived confusion matrix. Now we can also see all the four terms used in the above confusion matrix. Now we will find all the above-defined performance metrics from this confusion matrix.

Accuracy

Accuracy = (TP + TN) / (TP + TN + FP + FN)

So, Accuracy = (1+2) / (1+2+1+1)

                        = 3/5 which is 60%.

So, the accuracy from the above confusion matrix is 60%.

Precision 

Precision = TP / (TP + FP)

                 = 1 / (1+1)

                 =1 / 2 which is 50%.

So, the precision is 50%.

Recall 

Recall = TP / (TP + FN)

           = 1 / (1+1)

           = ½ which is 50%

So, the Recall is 50%.

F-measure 

F-measure = 2 * Recall * Precision / (Recall + Precision)

                    = 2*0.5*0.5 / (0.5+0.5)

                    = 0.5

So, the F-measure is 50%.

Confusion Matrix in Python

In this section, we will derive all performance metrics for a confusion matrix using Python

import os
import pandas as pd
import numpy as np
import matplotlib.pyplot as plt                      # Importing the required libraries
import seaborn as sns
%matplotlib inline
os.chdir("C:\Users\ABC\Desktop\bank")
df=pd.read_csv("bank.csv", delimiter=";",header='infer')
df.head()
df.columns   # Columns in the dataset
df.shape           # There are 4521 rows and 17 columns in data
df.info ()           # Checking info of data
df.dtypes        # Checking the data types of variables in data
df.describe()              # Summary statistics of numerical columns in data
df.isnull().sum()          # Checking the missing value in data. We can see that there is no missing value in data.
df.corr()                    # Correlation matrix
sns.heatmap(df.corr())         # Visualization of Correlation matrix Using heatmap

As we see, not a single feature is correlated completely with class, hence requires a combination of features.

sns.countplot(y='job', data= df)
sns.countplot(x='marital', data= df)
sns.countplot(x='y', data= df)
from sklearn import preprocessing
from sklearn.preprocessing import LabelEncoder
from sklearn import model_selection
from sklearn.linear_model import LogisticRegression
from sklearn import metrics                                       
from sklearn.metrics import accuracy_score,confusion_matrix
from sklearn.svm import SVC
from sklearn.ensemble import RandomForestClassifier

Sklearn offers a very effective technique for encoding the classes of a categorical variable into numeric format. LabelEncoder encodes classes with values between 0 and n_classes-1

le = preprocessing.LabelEncoder()
df.job = le.fit_transform(df.job)
df.marital = le.fit_transform(df.marital)
df.default = le.fit_transform(df.default)
df.education = le.fit_transform(df.education)
df.housing = le.fit_transform(df.housing)
df.loan = le.fit_transform(df.loan)
df.contact = le.fit_transform(df.contact)
df.month = le.fit_transform(df.month)
df.poutcome = le.fit_transform(df.poutcome)
df.y = le.fit_transform(df.y)
X= df.drop(["y"],axis=1)
y= df ["y"]        #### X consists of all independent variables and y has the dependent variable.
print(X.shape,y.shape)

Train and Test split

Now, we will split the data into training and testing sets. We will train the model with training data and will test the performance of our model on the test data which will be unknown for the model.

Here, we split data in train and test in 70:30.

X_train, X_test, y_train, y_test = model_selection.train_test_split(X, y, test_size=0.3, random_state=42)
Print (X_train.shape,X_test.shape, y_train.shape, y_test.shape)                             
model_log=LogisticRegression (max_iter=1000, random_state=42)
model_log.fit (X_train, y_train)
pred=model_log.predict (X_test)
accuracy_score (y_test, pred)
confusion_matrix (y_test, pred)
[[1175   30]
 [ 121   31]]
Print (classification_report (y_test, prediction_log))
          precision    recall f1-score   support
          0       0.91      0.98      0.94      1205
          1       0.51      0.20      0.29       152
    accuracy                           0.89      1357
   macro avg       0.71      0.59      0.62      1357
weighted avg       0.86      0.89      0.87      1357

Confusion Matrix study in R

Library (dplyr)
Library (ggplot2)
library (DataExplorer)
df=read.csv("adult.csv")
head(df)
summary(df)
colSums (is.na(df)) # Checking if there is any missing value or not column wise

Changing? into a new category ‘Missing’

df $workclass = ifelse (df $workclass=='?', 'Missing', as.character (df $workclass))
df $workclass = as.factor (df $workclass)
df $occupation = ifelse (df $occupation=='?', 'Missing', as.character(df $occupation))
df $occupation = as.factor (df $occupation)
df $native.country = ifelse(df $native.country== '?', 'Missing',as.character(df $native.country))
df $native.country = as.factor (df $native.country)
summary(df)
str(df)

Creating a new column target based on income column

df $target=ifelse (df $income == '>50K', 1, 0)
df $target=as.factor (df $target)

For checking outliers:

boxplot (df $capital.gain)
head (sort (df $capital.gain, decreasing = T),10)
boxplot (df $capital.loss)
boxplot (df $hours.per.week)

Changing Age column into 3 categories:

df $age=ifelse (df $age <= 30, 'Young', ifelse (df $age>30 & df $age <= 50, 'Mid-Age', 'Old'))
df $age=as.factor (df $age)
summary (df$age)
# Remove column income
df =select (df, -income)

Splitting data into test and train:

set.seed (1000)
index=sample (nrow (df), 0.70*nrow (df), replace=F)
train= df [index,]
test= df [-index,]
table(train$target)/22792
table(test$target)/9769

Applying logistic regression:

mod=glm(target~.,data=train,family='binomial')
summary(mod)
step (mod,direction = 'both')

2nd Iteration based on function call given by step function:

mod1=glm (formula = target ~ age + workclass + fnlwgt + education + 
           marital.status + occupation + relationship + race + sex + 
           capital.gain + capital.loss + hours.per.week + native.country, 
         family = "binomial", data = train)
summary(mod1)

Changing significant categorical var levels into dummies:

train$age_Young_d = ifelse (train$age== 'Young', 1, 0)
test$age_Young_d = ifelse (test$age== 'Young', 1, 0)

train$workclassLocalgov_d = ifelse (train$workclass== 'Local-gov', 1, 0)
test$workclassLocalgov_d = ifelse (test$workclass== 'Local-gov', 1, 0)

train$workclassMissing_d = ifelse (train$workclass== 'Missing', 1, 0)
test$workclassMissing_d = ifelse (test$workclass== 'Missing', 1, 0)

test$workclassPrivate_d = ifelse (test$workclass== 'Private', 1, 0)
train$workclassPrivate_d = ifelse (train$workclass== 'Private', 1, 0)

train$workclassSelfempnotinc_d = ifelse (train$workclass== 'Self-emp-not-inc', 1, 0)
test$workclassSelfempnotinc_d = ifelse (test$workclass== 'Self-emp-not-inc', 1, 0)

test$workclassSelfempinc_d = ifelse (test$workclass== 'Self-emp-inc', 1, 0)
train$workclassSelfempinc_d = ifelse (train$workclass== 'Self-emp-inc', 1, 0)

train$workclassStategov_d = ifelse (train$workclass== 'State-gov', 1, 0)
test$workclassStategov_d = ifelse (test$workclass== 'State-gov', 1, 0)

train$education1st_4th_d = ifelse (train$education== '1st-4th', 1, 0)
test$education1st_4th_d = ifelse (test$education== '1st-4th', 1, 0)
train$educationAssocacdm_d = ifelse (train$education== 'Assoc-acdm', 1, 0)
test$educationAssocacdm_d = ifelse (test$education== 'Assoc-acdm', 1, 0)

train$educationAssocvoc_d = ifelse (train$education== 'Assoc-voc', 1, 0)
test$educationAssocvoc_d = ifelse (test$education== 'Assoc-voc',1, 0)

train$educationBachelors_d = ifelse (train$education== 'Bachelors', 1, 0)
test$educationBachelors_d = ifelse (test$education== 'Bachelors', 1, 0)

train$educationDoctorate_d = ifelse (train$education== 'Doctorate', 1, 0)
test$educationDoctorate_d = ifelse (test$education== 'Doctorate', 1, 0)

train$educationHSgrad_d = ifelse (train$education== 'HS-grad', 1, 0)
test$educationHSgrad_d = ifelse (test$education== 'HS-grad', 1, 0)

train$educationMasters_d = ifelse (train$education== 'Masters', 1, 0)
test$educationMasters_d = ifelse (test$education=='Masters', 1, 0)

train$educationProfschool_d = ifelse (train$education== 'Prof-school', 1, 0)
test$educationProfschool_d = ifelse (test$education== 'Prof-school', 1, 0)
train$educationSomecollege_d = ifelse (train$education== 'Some-college', 1, 0)
test$educationSomecollege_d = ifelse (test$education== 'Some-college', 1, 0)
train$marital.statusMarriedAFspouse_d = ifelse (train$marital.status== 'Married-AF-spouse',1,0)
test$marital.statusMarriedAFspouse_d = ifelse (test$marital.status== 'Married-AF-spouse',1,0)
train$marital.statusMarriedcivspouse_d = ifelse (train$marital.status== 'Married-civ-spouse',1,0)
test$marital.statusMarriedcivspouse_d = ifelse (test$marital.status== 'Married-civ-spouse',1,0)
train$marital.statusNevermarried_d = ifelse (train$marital.status== 'Never-married', 1, 0)
test$marital.statusNevermarried_d = ifelse (test$marital.status== 'Never-married', 1, 0)
train$marital.statusWidowed_d = ifelse (train$marital.status== 'Widowed', 1, 0)
test$marital.statusWidowed_d = ifelse (test$marital.status== 'Widowed', 1, 0)
train$occupationExecmanagerial_d = ifelse (train$occupation== 'Exec-managerial', 1, 0)
test$occupationExecmanagerial_d = ifelse (test$occupation== 'Exec-managerial', 1,0)
train$occupationFarmingfishing_d = ifelse (train$occupation== 'Farming-fishing', 1, 0)
test$occupationFarmingfishing_d = ifelse (test$occupation== 'Farming-fishing', 1, 0)
train$occupationHandlerscleaners_d = ifelse (train$occupation== 'Handlers-cleaners', 1, 0)
test$occupationHandlerscleaners_d = ifelse (test$occupation== 'Handlers-cleaners', 1, 0)
train$occupationMachineopinspct_d = ifelse (train$occupation== 'Machine-op-inspct', 1, 0)
test$occupationMachineopinspct_d = ifelse (test$occupation== 'Machine-op-inspct', 1, 0)

train$occupationOtherservice_d = ifelse (train$occupation== 'Other-service', 1, 0)
test$occupationOtherservice_d = ifelse (test$occupation== 'Other-service', 1, 0)
train$occupationProfspecialty_d = ifelse (train$occupation== 'Prof-specialty', 1, 0)
test$occupationProfspecialty_d = ifelse (test$occupation== 'Prof-specialty', 1, 0)
train$occupationProtectiveserv_d = ifelse (train$occupation== 'Protective-serv', 1, 0)
test$occupationProtectiveserv_d = ifelse (test$occupation== 'Protective-serv', 1, 0)
train$occupationSales_d = ifelse (train$occupation== 'Sales', 1, 0)
test$occupationSales_d = ifelse (test$occupation== 'Sales', 1, 0)
train$occupationTechsupport_d = ifelse (train$occupation== 'Tech-support', 1, 0)
test$occupationTechsupport_d = ifelse (test$occupation== 'Tech-support', 1, 0)
train$relationshipOwnchild_d = ifelse (train$relationship== 'Own-child', 1, 0)
test$relationshipOwnchild_d = ifelse (test$relationship== 'Own-child', 1, 0)
train$relationshipWife_d = ifelse (train$relationship== 'Wife', 1, 0)
test$relationshipWife_d = ifelse (test$relationship== 'Wife', 1, 0)
train$raceAsianPacIslander_d=ifelse (train$race=='Asian-Pac-Islander', 1, 0)
test$raceAsianPacIslander_d=ifelse (test$race=='Asian-Pac-Islander', 1, 0)
train$raceWhite_d=ifelse (train$race== 'White', 1, 0)
test$raceWhite_d=ifelse (test$race=='White',1, 0)
train$native. countryColumbia_d=ifelse(train$native.country=='Columbia',1,0)
test$native. countryColumbia_d=ifelse(test$native.country=='Columbia',1,0)

train$native. countrySouth_d=ifelse(train$native.country=='South',1,0)
test$native. countrySouth_d=ifelse(test$native.country=='South',1,0)

3rd iteration by using significant dummy vars:

mod2=glm (formula=target~age_Young_d+workclassLocalgov_d+workclassMissing_d+workclassPrivate_d+
           workclassSelfempinc_d+workclassSelfempnotinc_d+workclassStategov_d+fnlwgt+
education1st_4th_d+educationAssocacdm_d+educationAssocvoc_d+educationBachelors_d+educationDoctorate_d+
           educationHSgrad_d+educationMasters_d+educationProfschool_d+educationSomecollege_d+marital. statusWidowed_d+
           marital. statusMarriedAFspouse_d+marital. statusNevermarried_d+marital.statusMarriedcivspouse_d+
           occupationExecmanagerial_d+occupationFarmingfishing_d+occupationHandlerscleaners_d+occupationMachineopinspct_d+
           occupationOtherservice_d+occupationProfspecialty_d+occupationProtectiveserv_d+occupationSales_d+
occupationTechsupport_d+relationshipWife_d+relationshipOwnchild_d+raceWhite_d+raceAsianPacIslander_d+
           sex+capital. gain+capital. loss+hours.per. week+native.countryColumbia_d+native.countrySouth_d,
         data=train, family='binomial')
summary(mod2)

Again, getting some insignificant vars. So, to remove those:

mod3=glm (formula=target~age_Young_d+workclassLocalgov_d+workclassMissing_d+workclassPrivate_d+workclassSelfempinc_d+workclassSelfempnotinc_d+workclassStategov_d+fnlwgt+education1st_4th_d+educationAssocacdm_d+educationAssocvoc_d+educationBachelors_d+educationDoctorate_d+educationHSgrad_d+educationMasters_d+educationProfschool_d+educationSomecollege_d+marital. statusWidowed_d+ marital. statusMarriedAFspouse_d+marital. statusNevermarried_d+marital.statusMarriedcivspouse_d+occupationExecmanagerial_d+occupationFarmingfishing_d+occupationHandlerscleaners_d+occupationMachineopinspct_d+occupationOtherservice_d+occupationProfspecialty_d+occupationProtectiveserv_d+occupationSales_d+occupationTechsupport_d+relationshipWife_d+relationshipOwnchild_d+raceWhite_d+sex+capital.gain+capital.loss+hours.per.week+native.countryColumbia_d+native.countrySouth_d, data=train, family='binomial')
summary(mod3)
# checking VIF value for this model to check multicollinearity
library(car)
library(caret)
library(e1071)
vif(mod3)
# now all variables are significant and vif value is also okay so this model mod3 is finalized
# Taking top 5 factors most influencing the target variable
head(sort(abs(mod3$coefficients), decreasing = T),6)

Model Validation

table(data$target)/nrow(data)
pred<-predict (mod3, type="response”, newdata=test)
pred<-ifelse (pred>=0.24, 1, 0)
pred=as.factor (pred)

Confusion matrix is for checking model accuracy:

confusionMatrix (pred, test$target, positive="1")
Output: 
Confusion Matrix and Statistics
                     Reference 
Prediction              0                  1
          0                 5934              374
          1                1477              1984 
Accuracy: 0.8105 95% 
CI: (0.8026, 0.8183) 
No Information Rate: 0.7586
 P-Value [Acc > NIR]: < 2.2e-16 
Kappa: 0.5538
 Mcnemar's Test P-Value: < 2.2e-16
 Sensitivity: 0.8414 
Specificity: 0.8007 
Pos Pred Value: 0.5732
 Neg Pred Value: 0.9407
 Prevalence: 0.2414
 Detection Rate: 0.2031 
Detection Prevalence: 0.3543
 Balanced Accuracy: 0.8210
 'Positive' Class: 1 

In this article, we covered what is confusion matrix, its need, and how to derive it in Python and R. If you wish to learn more about confusion matrix and other concepts of Machine Learning, upskill with Great Learning’s PG program in Machine Learning.

→ Explore this Curated Program for You ←

Avatar photo
Great Learning Editorial Team
The Great Learning Editorial Staff includes a dynamic team of subject matter experts, instructors, and education professionals who combine their deep industry knowledge with innovative teaching methods. Their mission is to provide learners with the skills and insights needed to excel in their careers, whether through upskilling, reskilling, or transitioning into new fields.

Recommended AI Courses

MIT No Code AI and Machine Learning Program

Learn Artificial Intelligence & Machine Learning from University of Texas. Get a completion certificate and grow your professional career.

4.70 ★ (4,175 Ratings)

Course Duration : 12 Weeks

AI and ML Program from UT Austin

Enroll in the PG Program in AI and Machine Learning from University of Texas McCombs. Earn PG Certificate and and unlock new opportunities

4.73 ★ (1,402 Ratings)

Course Duration : 7 months

Scroll to Top