PROBLEM STATEMENT
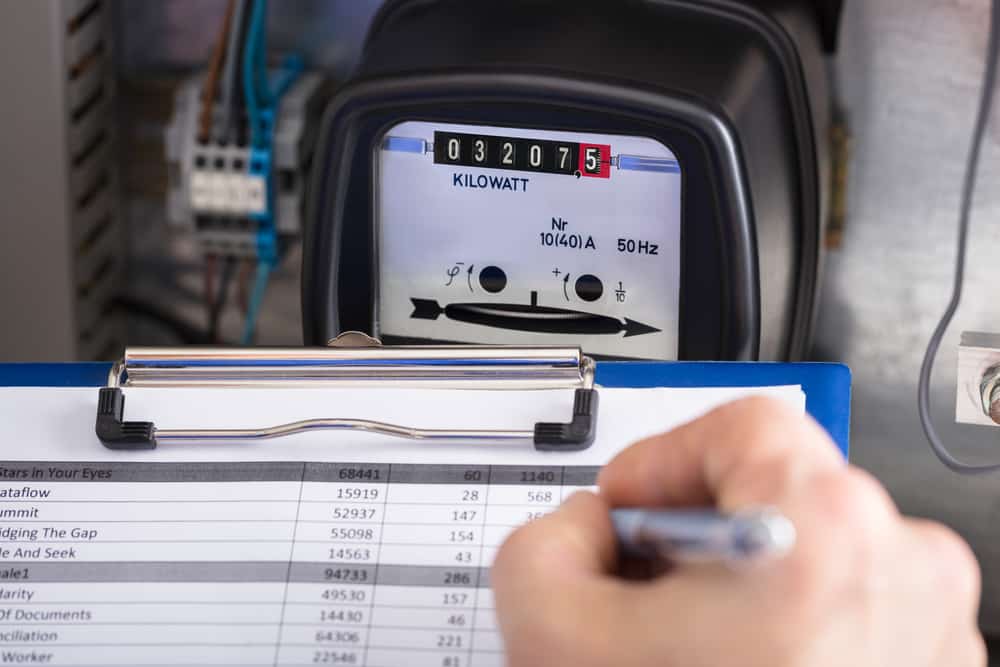
State Utility and energy supply companies currently use energy meters to measure the electricity consumption and chargeback to the consumers.
These meters display a cumulative electricity usage in KWH which is recorded manually and reported by the technicians to the power company on a monthly basis. Overall meter reading process requires tremendous manual effort, prone to human errors and is also open to manipulation.
Many times these energy meters become faulty and cause voltage/frequency fluctuations. This often goes undetected as there is no real-time monitoring mechanism.
These inefficiencies often result in losses, power wastage, and increased costs for the utility companies
PROPOSED SOLUTION:
The capstone project aims to leverage “smart meter” technology and AWS platform to achieve the following objectives:
- Completely automate the meter reading process via MQTT protocol over network
- Develop a monitoring framework to detect faults and power fluctuations to the power company
- Provide accurate and real-time power usage to the consumer
- Optimise the monthly billing cycles
- Create the utilisation matrix for Power Company to prevent meltdowns and predict regional demands for intelligent scale-up of operations
Smart meters
The project leverages smart meter technology, which enables the meters to transmit their power consumption and health metrics (voltage, current and frequency) directly to the IoT services hosted in AWS cloud over the WAN network. Smart meters need to be registered to the IoT core services, only the registered meters can communicate with the IoT core service.
IoT gateway is a device which resides in the close proximity of the smart meters and collects the data from the smart meter over the local network. The gateway then converts the collected meter data into JSON format and transmits it over the internet to AWS IoT core service using MQTT protocol.
In the project context, a customised python program has been developed to simulate smart meter and IoT gateway devices. The program can be installed on a laptop and each installation is given a unique meter serial number. This serial number needs to be first registered to the IoT core for it to communicate with the service.
IoT Core
IoT core service receives the streaming meter data and validates if the sender is a registered device. If the data is from a valid/registered device, it is passed to the Kinesis delivery stream.
Kinesis FireHose Delivery Stream
The Kinesis delivery stream transforms the data from JSON to CSV format and dumps it into the S3 bucket in the form of CSV flat files. As the streaming data is written into S3, an object create event triggers lambda function which reads the CSV flat file and pushes every record into Dynamodb.
S3
S3 bucket is the data lake for all the raw and historical meter data. Keeping in mind the daily data volume, data is partitioned into specific dated folders within the S3 bucket, this helps to increase the performance while querying /searching the data.
Athena
Database schema and tables have been defined in the AWS Athena whose columns map to the comma-separated field in the flat files. The tables have been partitioned by the “created date”, this helps to prune the data while querying and reduces costs. This mapping directly allows to select, filter, aggregate data from the flat files using SQL queries. Once the data is available in SQL format, it can be utilised for reporting and further processing.
Redash
Redash has been chosen as the reporting and analytics solution. It has a simple easy to use interface, out of box charting and reporting features, and supports all AWS data sources (Athena, RDS, Redshift, Dynamo). It is available as an AMI instance in AWS marketplace.
For this project, Redash analytics solution is hosted on an EC2 instance located in the public subnet and connects to Athena data source for fetching data for analytics and reporting.
There are two categories of reporting dashboards:
1) Consumer dashboards: These are accessed by the consumers for the current and historical power consumption for the last 6 months.
2) Monitoring dashboards: These are accessed by the utility companies, these are used to monitor region-wise power consumption, and detect faults and power outages
Cloudwatch Event
On 1st of every month at 8 AM a cloudwatch event triggers a lambda function. This lambda function aggregates raw consumption data for all meters for the past month from the Dynamodb table, converts them into monthly readings and pushes it into the RDS MYSQL database. This aggregated monthly consumption is further used to calculate the monthly bills to the consumers.
RDS MYSQL
RDS MYSQL database has been chosen to host the consumer data, meter master data and aggregated monthly consumption data and consumer billing information. The database is hosted in the private subnet and only accessible within the VPC via 3306 port.
Business Challenges & Technical Challenges
Technical Challenges:
- We faced a challenge to simulate smart meter behaviour, the other challenge was to ensure a secure communication channel between smart meters and IoT service.
Solution:
We developed a smart meter simulator program in python, which can generate readings at regular intervals. For secured communication, we generated certificates from the AWS IoT service and imported them into smart meters. Only the meters with certificates could now communicate with IoT service.
2. Dynamodb does not support standard SQL, hence selecting and aggregating data from Dynamodb was a challenge. Also, the aggregated data had to be put into an RDS database.
Solution:
This was achieved using the lambda function in python environment. Boto3 libraries were used to access data from Dynamodb.
RDS database engine was postgres initially, but there is no boto3 inbuilt library available for postgres database thus making it difficult to code in python.
Postgres database was eventually replaced with MYSQL database.
Learnings
Team has developed deep functional knowledge on the functioning of the energy meters, the recording of the meter readings and the key health check (voltage, current, frequency) metrics used for monitoring.
Team also adopted and learnt project planning techniques such as scope management, schedule estimation, cost estimation.
Learn AWS Cloud fundamentals and gain hands-on experience in deploying, managing, and scaling applications on AWS.
Following were the learnings for AWS perspective:-
IoT core service
- Configuration of IoT core service
- Onboarding of things in IoT core service
- Monitoring of communication between things and IoT core
- Creation of certificates for secured communication
- Define Rules and actions
Kinesis Delivery stream
- Configuration of Kinesis delivery stream
- Applying S3 prefixes to partition the data
S3 events
- Configuration of S3 buckets and folders
- Blocking public access to S3 bucket
- Creation of S3 events to trigger lambda functions
Lambda functions
- Creation of lambda functions
- Deploying lambda functions in VPC and private subnets
Python/Boto3
- Coding in python using boto3 libraries
- Selecting table data in cursors
- Accessing Dynamodb and MYSQL tables using python
Accessing data in Dynamodb
- Creation of tables in Dynamodb
- Inserting data into Dynamodb tables
- Selecting data from Dynamodb tables
Redash Analytics
- Deploying Redash AMI in VPC
- Creation of Athena datasources
- Creation of stored queries
- Creation and publishing of dashboards
Project Team
Shyam Prabhudesai has 20 years of work experience and works as Infrastructure delivery manager at IndiaIdeas.com
Jaymin Thakker has 19 years of work experience and works as Principal Software Architect at Wabtec Corporation
N Venkat Raman has 20 years of work experience, currently works as Sr. Technology Architect at Wipro.
Annapoorni Ramakrishnan works as a project management and solution architect in Oracle Financials in JP Morgan. She has 16 years of work experience.
If you wish to learn cloud computing and upskill in the domain, check out Great Learning's Postgraduate Program in Cloud Computing.
