Data Science with Python

Learn Data Science with Python from basics in this free online training. This free data science with python course is taught hands-on by experts. Learn about basics of Statistics, Descriptive statistics & a lot more.

4.61
average rating

Ratings

Beginner

Level

17.25 Hrs

Learning hours

96.2K+
local_fire_department

Learners

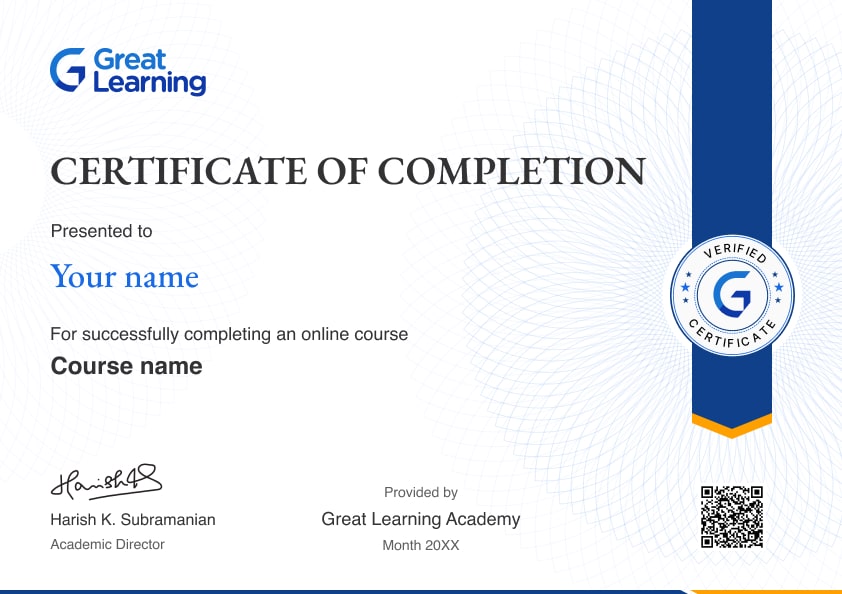
Earn a certificate of completion

blue-tick

Get free course content

blue-tick

Learn at your own pace

blue-tick

Master in-demand skills & tools

blue-tick

Test your skills with quizzes

Data Science with Python

17.25 Learning Hours . Beginner

Skills you’ll Learn

About this course

This Data Science with Python course is designed to equip you with skills to work with Python Programming to achieve Data Science tasks. You will be knowledgeable about the concept of statistics in detail, followed by a case study demonstration. You will then understand data transformation, different types of distributions, and histograms. You will further learn Python programming to understand some essential libraries of Python, such as NumPy, Pandas, Matplotlib, and Seaborn. This course will also teach regression models, data analytics, and data visualization concepts. Test the knowledge you gain from this course by completing the quiz and receiving a course completion certificate. 


Enroll in Great Learning’s Data Science Certificate Courses to become an accomplished expert in the domain. 


Why upskill with us?

check circle outline
1000+ free courses
In-demand skills & tools
access time
Free life time Access

Course Outline

Basics of Statistics

You will be introduced to statistics which comes with data problems, whereas machine learning is used to solve these problems in this first module of the course. The tutor also discusses some real-life scenarios of problems occurring with the data in statistics. Later you will understand three steps to process the information such as descriptive, predictive, and prescriptive. 

Descriptive Statistics

Descriptive statistics means describing the data without necessarily trying to build any prediction or model into it. In this module, the tutor will help you understand descriptive statistics by giving real-life examples. Next, you will learn the term random variable. Lastly, the tutor will familiarize you with the Cardio Good Fitness case study, which will be the main objective of the next module. 

Cardio Good Fitness Case Study for Descriptive Statistics

In this module, the tutor will help you to understand descriptive statistics with the help of a case study on Cardio Good Fitness. The case study will be carried out in Jupyter Notebook. You will also understand the descriptive analytics required to create customer profiles for the organization Cardio Good Fitness. You will learn briefly about the problem statement and how you can derive the solution using Numpy and Pandas libraries in the Jupyter notebook. 
 

Measures of Central Tendency

This section describes measures of central tendency by formulating to solve for the previously mentioned example. It also analyzes various metrics of the solution through graphs. 
 

Measures of Dispersion

This section describes the standard deviation by formulating to solve for it. It explains the relative tendency towards the most accurate solution through the derived observation. You will also learn to work with code in the Jupyter notebook to understand this better. You will also learn to graphically represent the observation, about data, and metadata in the later part of this section. 


Understanding Distributions & Histograms

In this module, you will come across various histograms and distributions created with the help of the Matplotlib library. Moving further, the tutor talks about how linear regression is connected with discrete and continuous data. Lastly, you will understand some use cases of analytics in organizations. 
 

Box Plots

This module will brief you on the use of the box plot function of the Seaborn library in Python. You will understand different parts of the box plot visualization, such as the median, upper quartile, and lower quartile. Next, you will learn to modify the box plot using its syntax. 

Summarizing Data

The next module will help you to understand how summarization is done using the crosstab function of Pandas library. Next, you will go through some examples where you needed summarized data as output. Lastly, you will familiarize yourself with the code used to summarize the data. 

Pair Plots

The module briefly discusses the pair plot function of the Seaborn library. You will learn to implement this function and what type of visualization will be your output for the data. The tutor briefs about the univariate analysis used in this pair plot visualization. Lastly, you will understand how the histogram is plotted using the pair plot function. 
 

Types of Data

This section introduces you to different types of data by helping you understand their graphical representations. It also explains its different components. 


Univariate statistical plots and usage

This section demonstrates working with the Jupyter notebook to derive various statistical plots like distributional plots with real-time examples. It also explains the derivations and answers to questions like why the raw data is insufficient. You will also learn various uses of these plots. 

Bivariate Statistics

The module starts with a discussion of bivariate variables in statistics. You will understand the relationship between two variables in a distribution. Next, the tutor will give you the formula to find variance and covariance that helps to derive the nature of the relationship between variables. Further, you will learn to find correlations in the distribution function. 

Multivariate Statistics

This module will conceptualize descriptive statistics, including univariate, bivariate, and multivariate distribution. Next, you will understand the prediction and actuality given by the algorithm. Moving ahead, you will. Get familiar with a key concept – Elasticity of Demand. Lastly, you will learn how linear regression works in any distribution. 
 

Intro to python

You will learn how to install Python and Pycharm IDE to get started with this programming language in this module. Next, you will get to know the installation steps of Anaconda Software. Lastly, you will learn to code your first program in Jupyter Notebook. 
 

Variables in Python

In this module, we’ll learn about a reserved memory location to store values called a python variable. A Python variable is a symbolic name that is a reference or pointer to an object.

Datatypes in Python

Variables are associated with datatypes. This module will brief you about different data types in Python, such as int, float, Boolean, and string. In the end, you will see the implementation of different data types in Python programming. 
 

Operators in Python

Python have three operator types: relational, arithmetic, and logical. The tutor will help you better understand these operators with the help of some examples in Python. 


Strings in Python

This module begins with an introduction to Python strings. You will learn to implement Python strings in 3 different ways in the Jupyter notebook. You will also be familiarized with some inbuilt string functions of Python. 
 

Tuples

A tuple is a data structure in Python used to store multiple values in a single variable. In this module, the tutor will brief you about tuples in Python and its coding demonstration. 
 

Lists

The list is another functional data structure in Python used to store an ordered collection of elements. The module will familiarize you with the use of lists in Python. Lastly, the tutor will help you learn some valuable functions of lists. 
 

Dictionary

Dictionary is an unordered collection that contains key-value pairs in it. You will learn to use the dictionary to store and define values to the key you declared in this module. The tutor will explain how to access the values using the keys from the dictionary. 
 

Sets

Set is also a data structure in Python used to store an unordered and unindexed collection of elements. The module will brief you about sets in Python with a practical demonstration of its use in programming. 
 

If Statement

Flow control statements provide great use in programming where different situations occur. The tutor will help you understand IF statements in Python followed by Else conditions. You will learn to give various if conditions in Python. 
 

Looping while

Looping statements are helpful for repeating a task. While and Loop are the two types of looping statements in Python. You will learn to use the while loop with practical implementation in Python programming in this module. 
 

For Loop

For loop is used when a function needs iterated statements or performs tasks multiple times. In this module, the tutor will brief you on the syntax of For loop with an example. 
 

Functions in python

Programming in Python allows you to create your own functions or use pre-defined functions. Functions help perform specific tasks. The tutor will help you understand functions in Python with a practical demonstration. 
 

Class and Objects in Python

The module starts by explaining classes and objects in Python. You will understand the properties and behavior of classes and objects. Next, you will learn about objects in Python that are nothing but instances of classes. 
 

Inheritance using code in Python

Inheritance means acquiring the properties of another class. You will learn to create an inheritance class that derives the features of the base class. 

Introduction to NumPy Array

You will be introduced to the Numpy package of Python in this module. You will learn to use this library to create single and multi-dimensional arrays using the Jupyter notebook. 
 

Numpy Shape

You will learn to use the NumPy shape function in this module. This function will help you to find the shapes of NumPy arrays. 
 

NumpyAarray Arithmetic

This module starts with some essential mathematical functions of Numpy arrays. The tutor will also brief you on implementing some arithmetic functions of Numpy arrays. 

Joining NumPy Arrays

There are three different modules to join Numpy arrays: vstack, hstack, and column stack. You will learn all these methods one by one in this module. 
 

Series object

In this module, you will be introduced to another Python package, Pandas. You will learn to use multi-dimensional data structures in Pandas with some examples. 
 

Dataframe

In this module, you will understand another important data structure in Python: Pandas DataFrame. A dataframe can be defined as a two-dimensional data structure that you will be using in this module. The tutor will brief some built-in functions of dataframe such as head(), shape(), describe(), and tail(). You will also see the implementation of these functions in the Python Jupyter notebook.
 

Data Visualization-Matplotlib

This module covers a package called Matplotlib, which is used to visualize the data using several visualizations such as bar plots, scatter plots, histograms, and others. You will learn to use some of these visualizations in Python. The tutor will also help you learn to make some modifications to the visualizations in programming. 
 

Intro to Linear Regression

In this module, you will understand linear regression and the different models that incorporate linear regression models. The tutor will familiarize you with some concepts around linear regression. 
 

Models and Maths for Linear Regression

This module will help you learn different data frames for the data models described by the tutor. You will also be familiarized with some functions used in linear regression. 
 

Relationship between the Independent variable and the Target variable

In this module, the tutor will discuss the relationship between independent and target variables in the plane. You will understand some use cases where the target and independent variables are related to each other by some correlation. 
 

Coefficient of Correlation

The module begins with an introduction to Supervised Machine Learning, where you will have to find the correlation of possible extreme values in linear regression models. You will also learn the relationship between variance and central value. Next, you will be familiarized with the coefficient of correlation and Pearson’s coefficient. 
 

Variance and Coefficient of Determinant

In this module, you will understand two types of variance: stochastic and deterministic. Next, you will be introduced to quadratic equations. Further, you will learn several errors in the coefficient of determinant. Lastly, you will briefly understand the coefficient of determinant with some examples. 
 

Linear Regression Assumptions

Here in this module, you will understand some linear regression assumptions, such as the assumption of linearity and the assumption of normality of the error distribution. Lastly, you will understand various dimensions to plot the linear regression models. 
 

Advantages and Disadvantages

Here in this module, you will learn some advantages and disadvantages of a linear regression model. The tutor will give you some examples to help you better understand the concepts. 
 

Data Preprocessing Demo

This module will demonstrate you to pre-process the data using the Matplotlib library. You will be familiarized with data pre-processing steps using the Jupyter notebook. You will also learn the transformations of data before you make any visualization. 
 

Density Graphs demo

The module is entirely based on the demo given on density graphs. You will be using the pair plot function of the Seaborn library to implement the various types of density graphs. Later on, the tutor will help you to recognize patterns in the graphs. 
 

Statistics Demo

You will be introduced to the statistics module, which contains some useful functions for our data analysis in this module. You will understand the importance of a z-score in standard deviation. Demonstrating the stats module will familiarize you with the statistical functions used in this module. 
 

Intro to Logistic Regression

The module will introduce you to logistic regression. You will learn to classify logistic regression with the help of a linear regression model. The tutor will show you the binary classification of this regression model that can also be used for multi-class classification. At last, you will learn to transform a line graph into a curved graph with the help of logistic regression classification. 
 

Sigmoid Curve and Logloss Function

In this module, you will understand the sigmoid curve with the help of prediction and actuals drawn from an example. Later, you will see how a linear model is passed to a logistic function in supervised machine learning. At last, you will be introduced to logloss function of the logistic regression model. 
 

Model Cases of Logistic Regression

This module cover four cases of linear regression models wherein the tutor will brief each case in detail with examples. You will learn to use different equations for different classifications of logistic regression. The tutor will brief you about the logloss function in the latter part of this module. 

Advantages and Disadvantages of Logistic Regression

Moving ahead, you will understand the advantages and disadvantages of the logistic regression model. The tutor will brief each point in detail to make every concept clearer to you. You will also be given some supporting examples of its advantages and disadvantages. 
 

Practice with Data Sets

The last module is a hands-on demonstration of a logistic regression model to predict diabetes among Pima Indians. You will also get the data set in the course materials that you can use to practice along with the course. The tutor will brief you on the data set's attributes to help build this machine-learning model more easily in the demonstration. You will get exposure to different functions and transformations of the data set to get desired visualizations. 
 

Trusted by 10 Million+ Learners globally

What our learners say about the course

Find out how our platform helped our learners to upskill in their career.

4.61
Course Rating
76%
19%
3%
0%
2%

What our learners enjoyed the most

Ratings & Reviews of this Course

Reviewer Profile

5.0

Mastered Data Manipulation and Visualization with Pandas and Matplotlib, and Gained Practical Insights into Machine Learning
I appreciated the course’s hands-on approach, especially the practical projects that applied data manipulation and visualization techniques using Pandas and Matplotlib. The clear explanations and real-world examples made complex concepts accessible. Additionally, the introduction to machine learning was well-structured and provided valuable insights into predictive modeling. Overall, the course effectively combined theory with practical skills, enhancing my confidence in data science.
Reviewer Profile

5.0

Data Science with Python Course: Online Program Covering Python, Data Science, Machine Learning, and Visualization, with Interactive Lessons and Quizzes
I'm now confident in my data science skills and ready to take on new challenges. I highly recommend this course to anyone looking to enhance their data science abilities.
Reviewer Profile

5.0

Comprehensive and Engaging Learning Experience
I really enjoyed the in-depth curriculum and the way the instructor presented the material. The quizzes and assignments were very engaging and helped reinforce the concepts. The course was easy to follow, and the topic depth was excellent, covering all the necessary details for a beginner to intermediate level understanding of data science. I appreciated the hands-on approach with practical exercises that made the learning process interactive and enjoyable.
Reviewer Profile

4.0

I Recently Completed a Python Course, and It Was Fantastic! The Content Was Easy to Follow, Making Complex Concepts Accessible for Beginners
I recently completed a Python course, and it was fantastic! The content was easy to follow, making complex concepts accessible for beginners. Each module was well-structured, with practical examples that reinforced learning. The instructor was knowledgeable and engaging, providing prompt support. Overall, this course is definitely worth the time and investment for anyone looking to enhance their programming skills. Highly recommend!
Reviewer Profile

5.0

It Was Very Insightful and Amazingly Explained
I loved the way each concept was explained in depth and was explained graphically. This helped me understand the concept more clearly. I had fun doing this course.
Reviewer Profile

5.0

Python for Data Science Offers Hands-On Experience with Data Analysis, Visualization, and Machine Learning, Enhancing Problem-Solving and Analytical Skills
Very good Python for Data Science equips learners with essential skills for analyzing and interpreting complex data. The course covers data manipulation with libraries like Pandas, visualization techniques using Matplotlib and Seaborn, and machine learning with Scikit-learn. Participants gain practical experience in handling real-world datasets, creating predictive models, and deriving actionable insights. This knowledge is crucial for making data-driven decisions, enhancing problem-solving abilities, and applying analytical methods in various industries.
Reviewer Profile

5.0

Loved the Course! Clear & Hands-On. Great for Aspiring Data Scientists. Audio Could Be Better, but Overall A+
The course was a hit! I loved how they broke things down and got us working on real stuff. If you're into data science, definitely check it out. Not gonna lie, the audio could use some work, and the whiteboard videos were a bit meh. But hey, I learned a ton and had fun doing it. I'd totally sign up for more courses from these guys.
Reviewer Profile

5.0

Excellent Learning Experiences and Amazing Teaching Staff
During my Data Science with Python certification, one of the most valuable experiences I had was working on a real-world dataset for a predictive modeling project. I began by cleaning the dataset, handling missing values and outliers using Python’s Pandas library. This was a crucial step as the raw data was quite noisy, and cleaning it improved the quality of my analysis.
Reviewer Profile

5.0

Easy to Follow Curriculum and Amazing Professors
I really understood the concepts. They were well taught. Especially Statistics.
Reviewer Profile

5.0

Experience Was So Good and Teaching Method Is So Easy to Understand
Teaching method and practice exercises, assignments, and all provided notes are so good. It helped me a lot.

Earn a certificate of completion

blue-tick

Get free course content

blue-tick

Learn at your own pace

blue-tick

Master in-demand skills & tools

blue-tick

Test your skills with quizzes

Data Science with Python

17.25 Learning Hours . Beginner

Frequently Asked Questions

What are the prerequisites required to learn this Data Science course?

Having a basic understanding of Python would help you learn the concepts better. However, the course is specially designed for beginners in Data Science, and any enthusiast can enroll and take benefit from this course. 
 

How long does it take to complete this free Data Science course?

The course contains video content of 11 hours of duration that you can finish at your own pace. This online Data Science with Python course is self-paced, and you can finish the modules whenever you want. 
 

Will I have lifetime access to the free course?

Yes, this course has lifetime access, and you can study this course at any time of your convenience. This course doesn’t have restrictions over time, and you can access this course anytime. 

Is the Data Science with Python course a certification course?

This Data Science with Python course earns you a certificate of completion, not a professional certification.

What are my next learning options after this Data Science course?

Enthusiasts looking forward to building a career in the Data Science domain can choose the Applied Data Science course. The paid program will help to advance the learnings of Data Science and build a successful career in this domain. 

Is it worth learning Python for Data Science?

Yes, the future seems bright for both Python and Data Science. There are huge requirements for Data Scientists and Data Analysts in almost all types of organizations. Suppose you are looking for a highly demanded career to start working with. In that case, learning this free online Data Science with Python course will help you build a promising career in one of the most exciting and demanding domains. 

What is Data Science used for?

Data Science is beneficial for finding insights over a large amount of data. These insights help understand various data-related tasks across industries. Each organization collects some sort of data that means everything to these companies as it is used to find patterns that help to make decisions in the future. 
 

Why is Data Science so popular?

Data Science has been the most popular technology because it helps businesses to make crucial decisions through raw data transformation into valuable insights. These insights can be calculated from the data collected by these companies. 
 

What jobs demand that you learn Python for Data Science?

There are a number of jobs that require learning Python for Data Science. Some of the most popular jobs include the following:

  • Data Analyst
  • Data Scientist
  • Python Developer
  • ML Engineer
  • Data Engineer
  • Analytics Manager
     

Will I get a certificate after completing this Data Science course?

Yes, when you finish all the course modules, you need to take a quiz to help you gain a course completion certificate. 

What knowledge and skills will I gain upon completing this Data Science course?

This free online course in Python for Data Science is a complete package to familiarize you with all the concepts of Data Science. You will learn statistics, histograms, libraries of Python, visualizations, data frames, regression models, and logistic regression. The course will help you gain valuable skills such as Machine Learning, Data Science, Data Analysis, Data Transformations, and Data Modelling. 
 

How much does this Data Science course cost?

The course is entirely free, and any learner can enroll in this course without any charge. 
 

Is there a limit on how many times I can take this free online course in Python for Data Science?

No, the course doesn’t put any restrictions on how many times you take this course. Anytime you feel about revising the learnings, you can go back to the course and brush up on your skills. 
 

Why choose Great Learning Academy for this Data Science with Python course?

Great Learning Academy is a leading platform that offers courses in various domains. There are more than 5M learners worldwide who are benefitted from these courses. This free Data Science course will help you to learn statistics, regression, and Python to implement Data Science and Analytics. Hence, choosing this course is beneficial to building a career in this domain. 
 

Who is eligible to take this Data Science course?

Any enthusiast interested in pursuing a career in Data Science and learning best Python practices can choose for this course as there are no eligibility criteria to enroll and learn from this course. 

What are the steps to enroll in this course?

The steps required to enroll in this course include the following:

1. Go to the site of Great Learning Academy.
2. Search for ‘Data Science with Python’ in the search bar.
3. Click on the ‘Enroll for Free’ button at the top of the course page.
4. Create an account by providing the required details.
5. Once successfully enrolled, you can access the account dashboard and begin the course. 
 

Can I sign up for multiple courses from Great Learning Academy at the same time?

Yes, you can enroll in as many courses as you want from Great Learning Academy. There is no limit to the number of courses you can enroll in at once, but since the courses offered by Great Learning Academy are free, we suggest you learn one by one to get the best out of the subject.

Recommended Free Data Science courses

Free
Marketing & Retail Analytics - Advanced
course card image

Free

Advanced

Free
Data Science Mathematics
course card image

Free

Beginner

Free
Excel for Data Science for Beginners
course card image

Free

Beginner

Similar courses you might like

Free
Introduction to Hadoop
course card image

Free

Beginner

Free
Statistics for Data Science
course card image

Free

Beginner

Free
Python for Data Analysis
course card image

Free

Beginner

Free
R in Data Science
course card image

Free

Beginner

Related Masterclasses Courses

50% Average salary hike
Explore degree and certificate programs from world-class universities that take your career forward.
Personalized Recommendations
checkmark icon
Placement assistance
checkmark icon
Personalized mentorship
checkmark icon
Detailed curriculum
checkmark icon
Learn from world-class faculties

Data Science with Python Course


Data Science with Python has become one of the most popular courses in many universities and colleges. The course provides an introduction to the tools and techniques of data science, which is a field of study that uses mathematical and computational techniques to analyze and visualize data. This course is designed to give students the knowledge and skills to use Python for data science applications. This course will cover a variety of topics related to data science with Python, including descriptive statistics, understanding distributions and plots, univariate statistical plots and usage, bivariate and multivariate statistics, intro to Python, variables, datatypes and strings in Python, relationship between independent variable and target variable, linear regression assumptions, sigmoid curve and logloss function.


The course is designed to help students understand the fundamentals of data science with Python. The first part of the course focuses on descriptive statistics, which is used to summarize and explain data. It will cover topics such as measures of central tendency (mean, median, mode), measures of variability (range, variance, standard deviation), and measures of skewness and kurtosis. Students will learn how to use graphical methods to visualize data, such as histograms, boxplots, and scatterplots.


The second part of the course will cover univariate and bivariate statistics. Students will learn about the relationship between two variables, such as correlation and regression. They will also learn about hypothesis testing and how to use the t-test and chi-squared test to assess the relationship between two variables. 


The third part of the course focuses on intro to Python, variables, datatypes and strings in Python. Students will learn the basics of Python, such as variables, datatypes, and strings. They will also learn how to use the Python programming language to manipulate data, such as creating functions, reading and writing data, and performing basic calculations. 


The fourth part of the course focuses on the relationship between independent variable and target variable. This section will cover linear regression assumptions and how to interpret the coefficients and p-values of the regression equation. Additionally, students will learn about sigmoid curves and logloss functions. 


The fifth part of the course focuses on data visualization with Python. Students will learn how to create different types of visualizations, such as line plots, bar graphs, and scatter plots. They will also learn about the principles of effective data visualization and how to create interactive visualizations using Python. 
Enrol for Free