Free Data Analytics Course using Google Gemini
Data Analytics using Google Gemini with Excel and Python
Learn data analysis with Python, Excel, and Google Gemini, cleaning, EDA, charting, automation, and regression modeling. Join our free Data Analytics Course using Google Gemini with Excel and Python to build AI-powered skills.
Data Analytics using Google Gemini with Excel and Python
4.4K+ learners enrolled so far
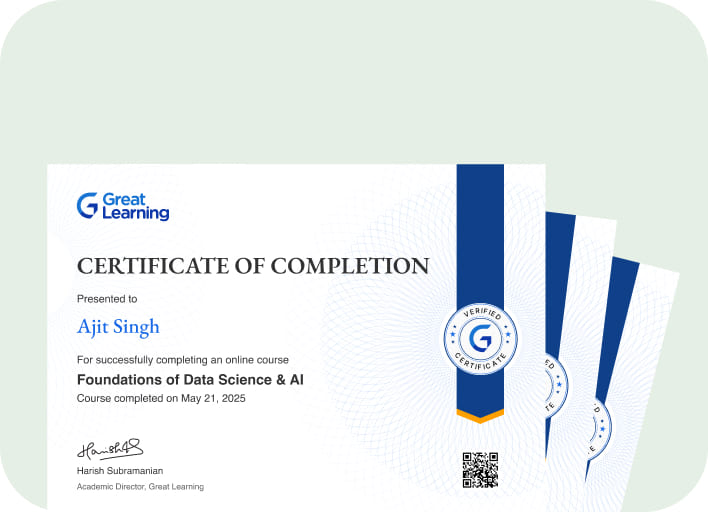
Stand out with an industry-recognized certificate
10,000+ certificates claimed, get yours today!
Get noticed by top recruiters
Share on professional channels
Globally recognised
Land your dream job

Skills you will gain
Importing Data
Cleaning Data Visualizing Data
Summary Statistics
Univariate and Bivariate analysis
Model Building for Regression
Key Highlights
Get free course content
Master in-demand skills & tools
Test your skills with quizzes
About this course
This free Excel for data analytics Gemini Course introduces you to the core skills needed to analyze data with the combined power of Python, Excel, and Gemini. You will learn how to use Gemini to generate Python code for data cleaning, handling missing values, and computing summary statistics, along with performing Exploratory Data Analysis to identify trends and patterns through charts and visualizations. The course also demonstrates how Gemini can help in data work directly in Excel, whether it is cleaning spreadsheets or building pivot tables and charts, doing so with accuracy and in a matter of a few seconds.
By the end of the course, you will be able to run end-to-end data analysis workflows using Python and Excel with Gemini as your AI assistant. You will understand how to visualize data, build simple regression models, interpret performance metrics, and automate routine analytical tasks. This course equips you with practical, industry-ready skills that help you work faster, solve problems with confidence, and strengthen your capabilities in AI-assisted data analytics.
Course outline
Introduction to Data Analysis using Python and Bard
This module will teach you the fundamentals of data analysis using Bard. You will learn how to import data from a variety of sources, handle missing values, and generate summary statistics. You will also learn how to use Bard to explore your data and identify patterns and trends.
EDA using Python and Bard
This module will teach you how to explore univariate and bivariate analysis using a variety of charts. You will learn how to use histograms, heatmaps, to visualize the distribution of data, identify patterns and trends, and explore the relationships between variables.
Data Modeling for Regression using Python and Bard
This module will introduce you to the basics of regression modeling using Python and Bard. You will learn how to fit a regression model to data, evaluate its performance, and use Bard to implement a regression model.
Introduction to Data Analysis using Excel and Bard
This module will teach you the fundamentals of data analysis using Excel and Bard. You will learn how to import data, handle missing values and duplicate values, and generate summary statistics.
EDA using Excel and Bard
This module will teach you how to use Excel commands to explore univariate and bivariate analysis and understand a variety of charts, including Scatter plot, histograms, and pivot tables. You will also learn how to apply various prompts using Bard to automate your data analysis tasks.
Get access to the complete curriculum once you enroll in the course
Stand out with an industry-recognized certificate
10,000+ certificates claimed, get yours today!
Get noticed by top recruiters
Share on professional channels
Globally recognised
Land your dream job

Data Analytics using Google Gemini with Excel and Python

3.0 Hours
Beginner
4.4K+ learners enrolled so far
Get free course content
Master in-demand skills & tools
Test your skills with quizzes
Learner reviews of the Free Courses

5.0
5.0
Frequently Asked Questions
Will I receive a certificate upon completing this free course?
Is this course free?
What are the prerequisites required to learn this Free Data Analytics using Google Gemini Course?
You do not need any prior knowledge to learn this Data Analytics using Google GeminiCourse.
Who is this Data visualization with Excel and Python in Gemini free course suitable for?
The course targets learners who desire to improve their data analysis abilities on Python, Excel and Google Gemini. It is perfect for analysts, students, and professionals interested in automating data tasks with the help of AI.
What will I learn in this course?
You will learn how to use Gemini to generate Python and Excel workflows for:
- Data cleaning
- Summary statistics
- Visualization
- Regression modeling.
You will also understand how to apply AI prompts to automate repetitive data tasks across both tools.
Will I have lifetime access to the free course?
Yes, once you enrol in the course, you will have lifetime access to any of the Great Learning Academy’s free courses. You can log in and learn whenever you want to.
Do I need experience in Python or Excel to join this excel for data analytics Gemini free course?
You do not need any advanced background. Basic familiarity with either Python or Excel is helpful, but Gemini-assisted prompts make the learning process simple and efficient.
Will I get a certificate after completing this Free Data Analytics using Google Gemini Course?
You will receive a certificate after completing all modules. A certificate is available for a nominal fee upon successful completion.
How does Gemini support data analysis?
Gemini helps you:
- Generate clean Python code
- Automate Excel tasks
- Create charts
- Produce quick insights.
It reduces manual effort and speeds up every stage of the analysis pipeline from data cleaning to modeling.
What modules are included in the Free Data analytics using Google Gemini and Python course?
The course includes modules on: Python based data analysis Excel based data analysis Regression modeling EDA across both tools. Each module shows how Gemini can support code generation, visualization, and structured analysis.
Is there any limit on how many times I can take this free course?
No. There is no limit. Once you enrol in the Free Data Analytics using Google Gemini Course, You have lifetime access to it. So, you can log in anytime and learn it for free online.
What skills will I gain after completing this course?
You will build strong skills in:
- AI assisted data analysis
- Exploratory Data Analysis (EDA)
- Data visualization
- Statistical modeling
- Automating data tasks.
These skills help you work faster and more accurately on real datasets.
How will this course help me in real projects?
You will learn workflows that allow you to clean data, generate charts, build models, and summarize insights using AI powered prompts. This helps you produce reports, dashboards, and analytical outputs much more efficiently for real business challenges.
Become a Skilled Professional with Pro Courses
Gain work-ready skills with guided projects, top faculty and AI tools, all at an affordable price.


View Course

Included with Pro+ Subscription

View Course

Included with Pro+ Subscription


View Course

Included with Pro+ Subscription

View Course

Included with Pro+ Subscription

View Course

Included with Pro+ Subscription

View Course

Included with Pro+ Subscription
 (1).jpg)
View Course

Included with Pro+ Subscription
.jpg)
View Course

Included with Pro+ Subscription


View Course

Included with Pro+ Subscription


View Course

Included with Pro+ Subscription


View Course

Included with Pro+ Subscription


View Course

Included with Pro+ Subscription


View Course

Included with Pro+ Subscription


View Course

Included with Pro+ Subscription

View Course

Included with Pro+ Subscription


View Course

Included with Pro+ Subscription


.jpg)
View Course

Included with Pro+ Subscription

View Course

Included with Pro+ Subscription

View Course

Included with Pro+ Subscription

View Course

Included with Pro+ Subscription

View Course

Included with Pro+ Subscription
.png)
View Course

Included with Pro+ Subscription
.jpg)
View Course

Included with Pro+ Subscription
.jpeg)
View Course

Included with Pro+ Subscription
.jpg)
View Course

Included with Pro+ Subscription
.jpg)
View Course

Included with Pro+ Subscription
View Course

Included with Pro+ Subscription


View Course

Included with Pro+ Subscription


View Course

Included with Pro+ Subscription


View Course

Included with Pro+ Subscription
.png)
View Course

Included with Pro+ Subscription


.png)


View Course

Included with Pro+ Subscription

View Course

Included with Pro+ Subscription

View Course

Included with Pro+ Subscription
.png)
View Course

Included with Pro+ Subscription
.png)
View Course

Included with Pro+ Subscription
.png)
View Course

Included with Pro+ Subscription

View Course

Included with Pro+ Subscription

View Course

Included with Pro+ Subscription

View Course

Included with Pro+ Subscription
.jpg)
View Course

Included with Pro+ Subscription
.png)
View Course

Included with Pro+ Subscription

View Course

Included with Pro+ Subscription

View Course

Included with Pro+ Subscription

View Course

Included with Pro+ Subscription
View Course

Included with Pro+ Subscription

View Course

Included with Pro+ Subscription

View Course

Included with Pro+ Subscription

View Course

Included with Pro+ Subscription


View Course

Included with Pro+ Subscription
.png)
View Course

Included with Pro+ Subscription
Popular


View Course

Included with Pro+ Subscription

View Course

Included with Pro+ Subscription


View Course

Included with Pro+ Subscription

View Course

Included with Pro+ Subscription

View Course

Included with Pro+ Subscription

View Course

Included with Pro+ Subscription
 (1).jpg)
View Course

Included with Pro+ Subscription
.jpg)
View Course

Included with Pro+ Subscription
Microsoft Courses


View Course

Included with Pro+ Subscription


View Course

Included with Pro+ Subscription


View Course

Included with Pro+ Subscription


View Course

Included with Pro+ Subscription


View Course

Included with Pro+ Subscription


AI & Generative AI

View Course

Included with Pro+ Subscription

View Course

Included with Pro+ Subscription


View Course

Included with Pro+ Subscription


.jpg)
View Course

Included with Pro+ Subscription

View Course

Included with Pro+ Subscription

View Course

Included with Pro+ Subscription
Management

View Course

Included with Pro+ Subscription

View Course

Included with Pro+ Subscription
.png)
View Course

Included with Pro+ Subscription
.jpg)
View Course

Included with Pro+ Subscription
.jpeg)
View Course

Included with Pro+ Subscription
.jpg)
View Course

Included with Pro+ Subscription
.jpg)
View Course

Included with Pro+ Subscription

View Course

Included with Pro+ Subscription

View Course

Included with Pro+ Subscription
.png)
View Course

Included with Pro+ Subscription
.png)
View Course

Included with Pro+ Subscription
.png)
View Course

Included with Pro+ Subscription
 (1).jpg)
View Course

Included with Pro+ Subscription

View Course

Included with Pro+ Subscription
.png)
View Course

Included with Pro+ Subscription
.png)
View Course

Included with Pro+ Subscription
Cloud Computing


View Course

Included with Pro+ Subscription


View Course

Included with Pro+ Subscription


View Course

Included with Pro+ Subscription
.png)
View Course

Included with Pro+ Subscription


.png)


View Course

Included with Pro+ Subscription


View Course

Included with Pro+ Subscription
.png)

View Course

Included with Pro+ Subscription
.jpg)

.jpg)

.png)

View Course

Included with Pro+ Subscription


Cyber Security

View Course

Included with Pro+ Subscription

View Course

Included with Pro+ Subscription
.png)
View Course

Included with Pro+ Subscription
.png)
View Course

Included with Pro+ Subscription
.png)
View Course

Included with Pro+ Subscription
IT & Software

View Course

Included with Pro+ Subscription

View Course

Included with Pro+ Subscription

View Course

Included with Pro+ Subscription
.jpg)
View Course

Included with Pro+ Subscription
.png)
View Course

Included with Pro+ Subscription

View Course

Included with Pro+ Subscription

View Course

Included with Pro+ Subscription

View Course

Included with Pro+ Subscription

View Course

Included with Pro+ Subscription


View Course

Included with Pro+ Subscription
 (1).png)
View Course

Included with Pro+ Subscription


View Course

Included with Pro+ Subscription

View Course

Included with Pro+ Subscription


View Course

Included with Pro+ Subscription
.png)
View Course

Included with Pro+ Subscription
.png)
View Course

Included with Pro+ Subscription

View Course

Included with Pro+ Subscription

View Course

Included with Pro+ Subscription

View Course

Included with Pro+ Subscription

View Course

Included with Pro+ Subscription

View Course

Included with Pro+ Subscription
Data Science & ML

View Course

Included with Pro+ Subscription

View Course

Included with Pro+ Subscription

View Course

Included with Pro+ Subscription

View Course

Included with Pro+ Subscription


View Course

Included with Pro+ Subscription
.png)
View Course

Included with Pro+ Subscription
Subscribe to Academy Pro+ & get exclusive features
$25/month
No credit card required

Learn from 40+ Pro courses
Access 500+ certificates for free
700+ Practice exercises & guided projects
Prep with AI mock interviews & resume builder
Recommended Free Generative AI courses
.jpg)

.jpg)
Similar courses you might like


Related ChatGPT and Generative AI Courses
-
Programs starting at ₹5,000 per month
Placement assistance
Personalized mentorship
Detailed curriculum
Learn from world-class faculties
50% Average salary hike -
Scholarships upto ₹25K


McCombs School of Business at The University of Texas at Austin
PG Program in Artificial Intelligence & Machine Learning12 Months · Online
#1 Ranked AI ProgramKnow More
-
Scholarships upto ₹25K


McCombs School of Business at The University of Texas at Austin
Artificial Intelligence PG Program for Leaders5 Months · Online · weekend
No Programming Exp RequiredKnow More
-


6 Months · Online
Know More


